Fig. 2
Download original image
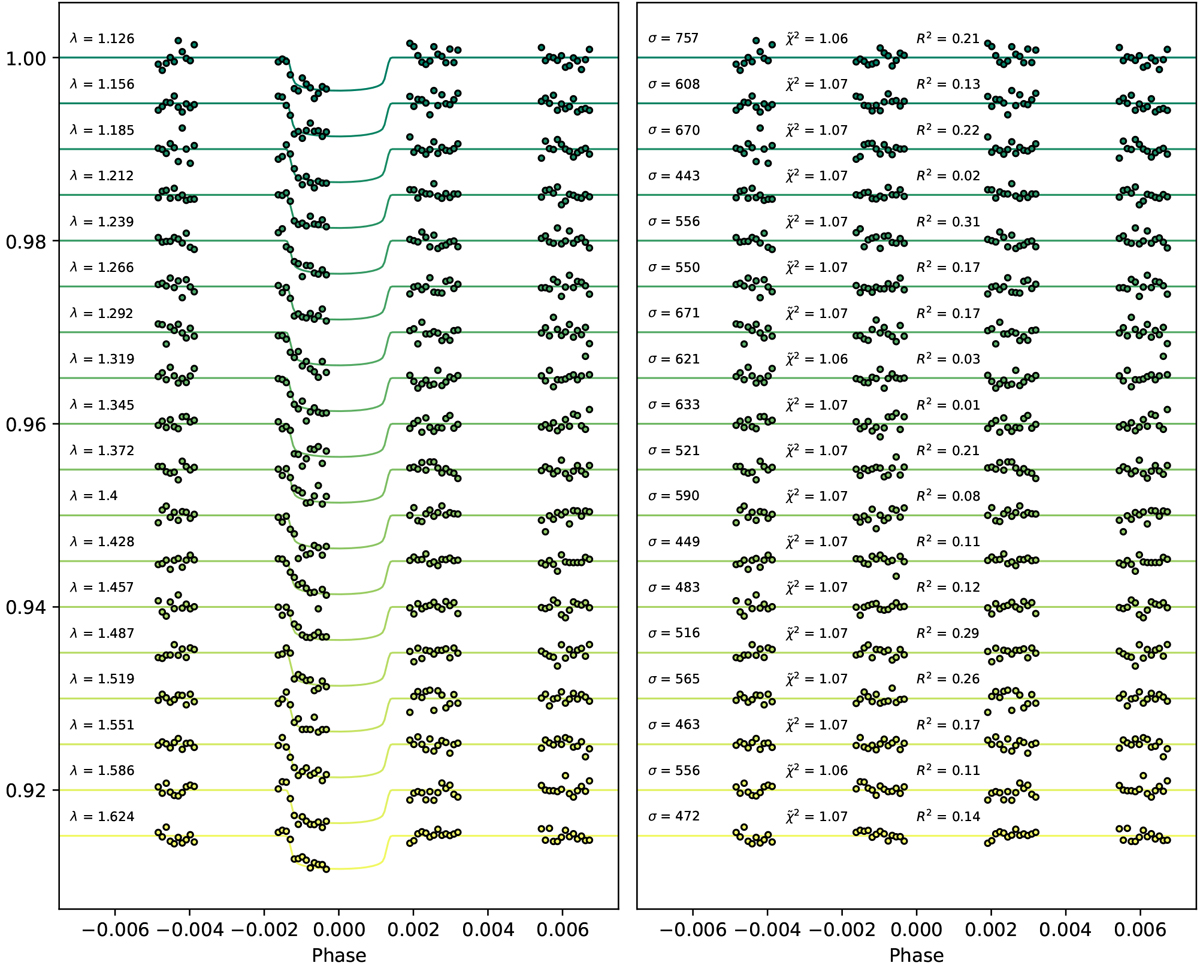
Spectral light curve fits of the September 2019 visit (Observation 2) for the transmission spectra of TRAPPIST-1 h. An artificial offset in the y-axis was applied for clarity. For each light curve, the left panelshows the de-trended spectral light curves with the best fit model in dotted lines with the centred wavelength and the right panel shows the residuals and values for the standard deviation (σ) in ppm, the reduced Chi-squared (![]() ), and the auto-correlation (R2).
), and the auto-correlation (R2).
Current usage metrics show cumulative count of Article Views (full-text article views including HTML views, PDF and ePub downloads, according to the available data) and Abstracts Views on Vision4Press platform.
Data correspond to usage on the plateform after 2015. The current usage metrics is available 48-96 hours after online publication and is updated daily on week days.
Initial download of the metrics may take a while.