Fig. B.5
Download original image
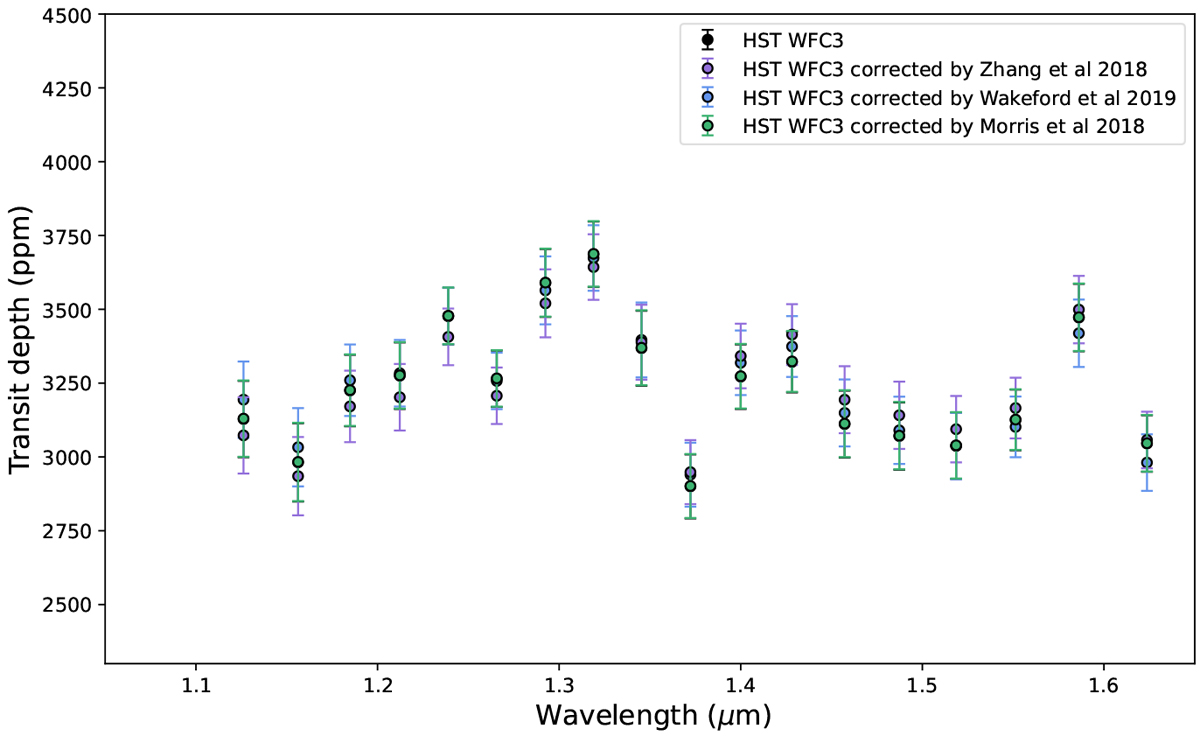
Combined transit depth in ppm using the three HST/WFC3 G141 transit observations and corrected transit depth using stellar contamination models from Zhang et al. (2018) (purple), Wakeford et al. (2019) (blue), and Morris et al. (2018) (green). The latter (in green) and the raw extracted spectrum (in black) are almost similar because the stellar contribution of Morris et al. (2018) is flat in the HST/WFC3 NIR wavelength range.
Current usage metrics show cumulative count of Article Views (full-text article views including HTML views, PDF and ePub downloads, according to the available data) and Abstracts Views on Vision4Press platform.
Data correspond to usage on the plateform after 2015. The current usage metrics is available 48-96 hours after online publication and is updated daily on week days.
Initial download of the metrics may take a while.