Free Access
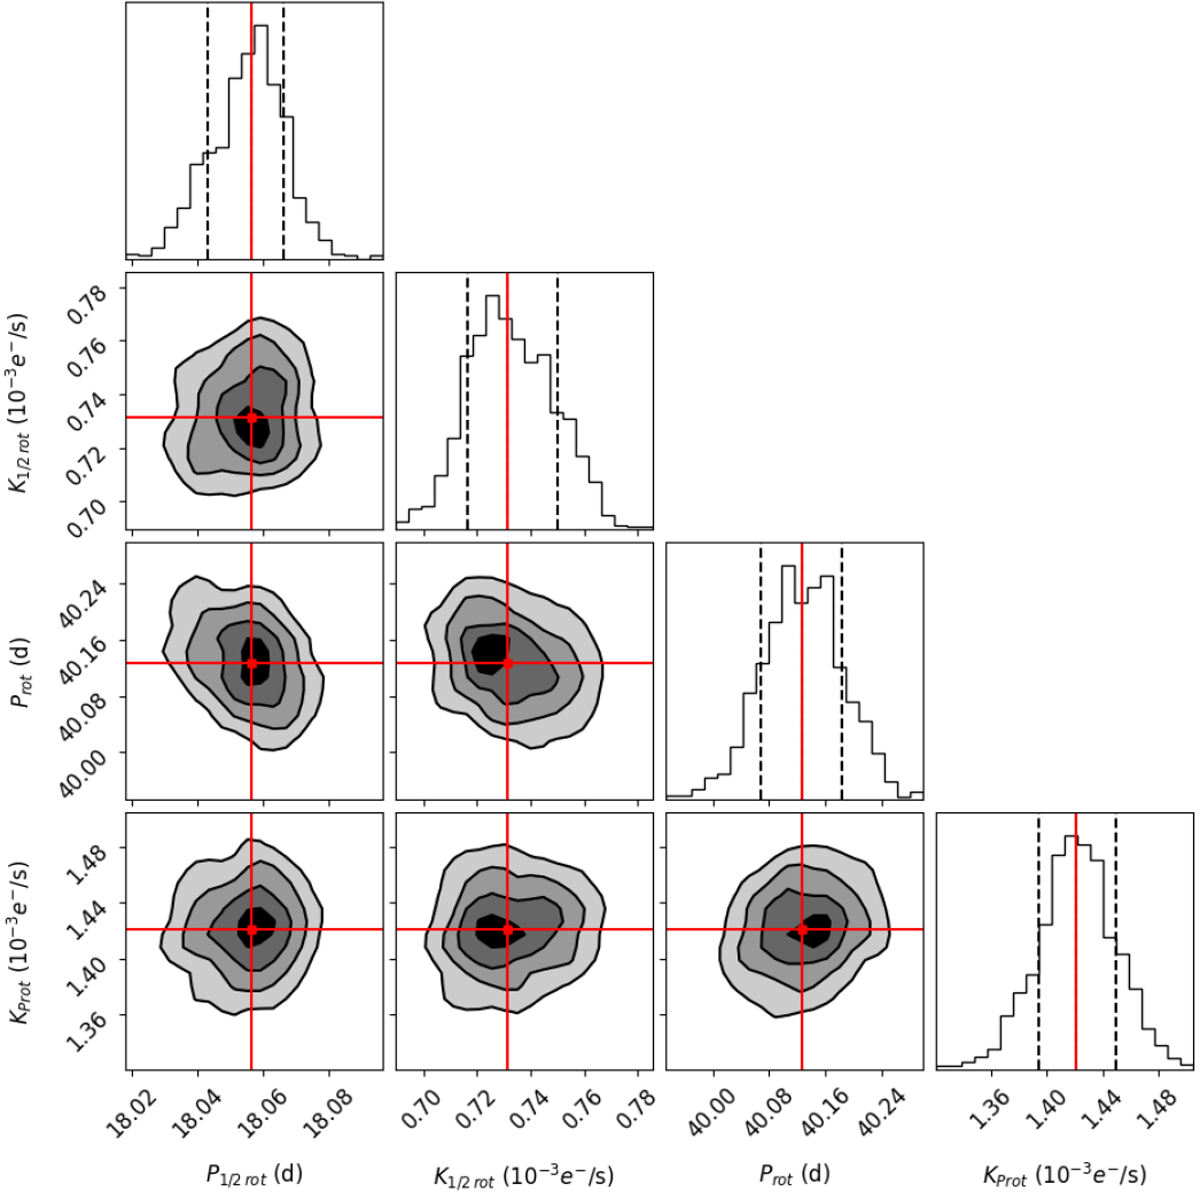
Fig. 9
Download original image
Posterior distributions of the sinusoidal fit to the TESS SAP fluxes. Vertical dashed lines correspond to the 16 and 84% quantiles (1σ uncertainty). The red line stands for the mean values of the distributions.
Current usage metrics show cumulative count of Article Views (full-text article views including HTML views, PDF and ePub downloads, according to the available data) and Abstracts Views on Vision4Press platform.
Data correspond to usage on the plateform after 2015. The current usage metrics is available 48-96 hours after online publication and is updated daily on week days.
Initial download of the metrics may take a while.