Fig. 8
Download original image
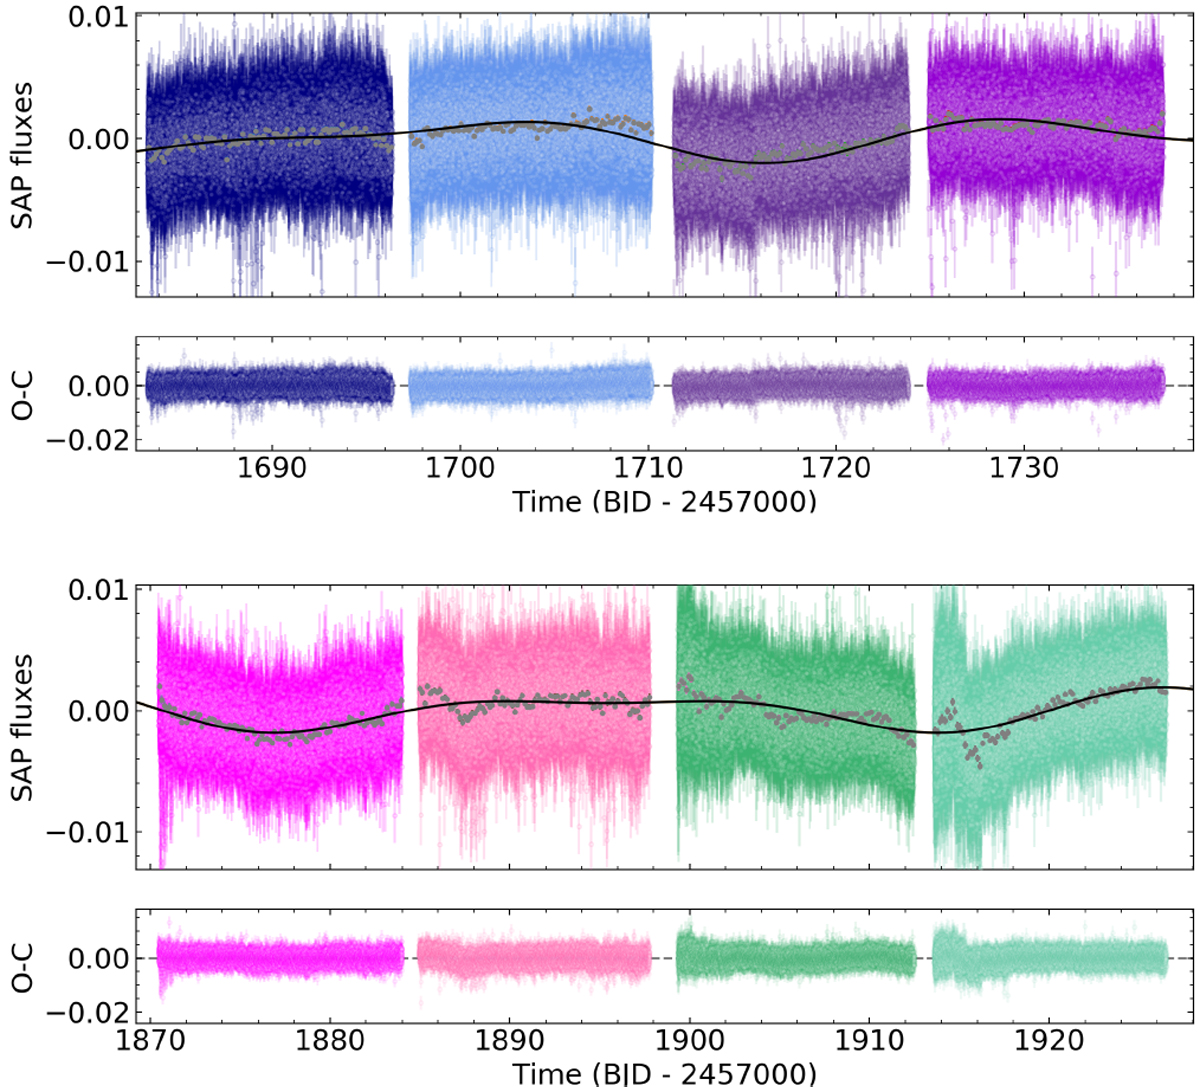
TESS photometry. Top panels: TOI-1238 TESS SAP photometric fluxes for the four different sectors (each half sector is shown with a different color) normalized to a common reference by fitting sinusoidal functions. The best model fit is plotted asthe solid black line, and the binned photometric data are indicated with gray dots. Bottom panels: residuals shown as a function of time.
Current usage metrics show cumulative count of Article Views (full-text article views including HTML views, PDF and ePub downloads, according to the available data) and Abstracts Views on Vision4Press platform.
Data correspond to usage on the plateform after 2015. The current usage metrics is available 48-96 hours after online publication and is updated daily on week days.
Initial download of the metrics may take a while.