Free Access
Fig. A.5
Download original image
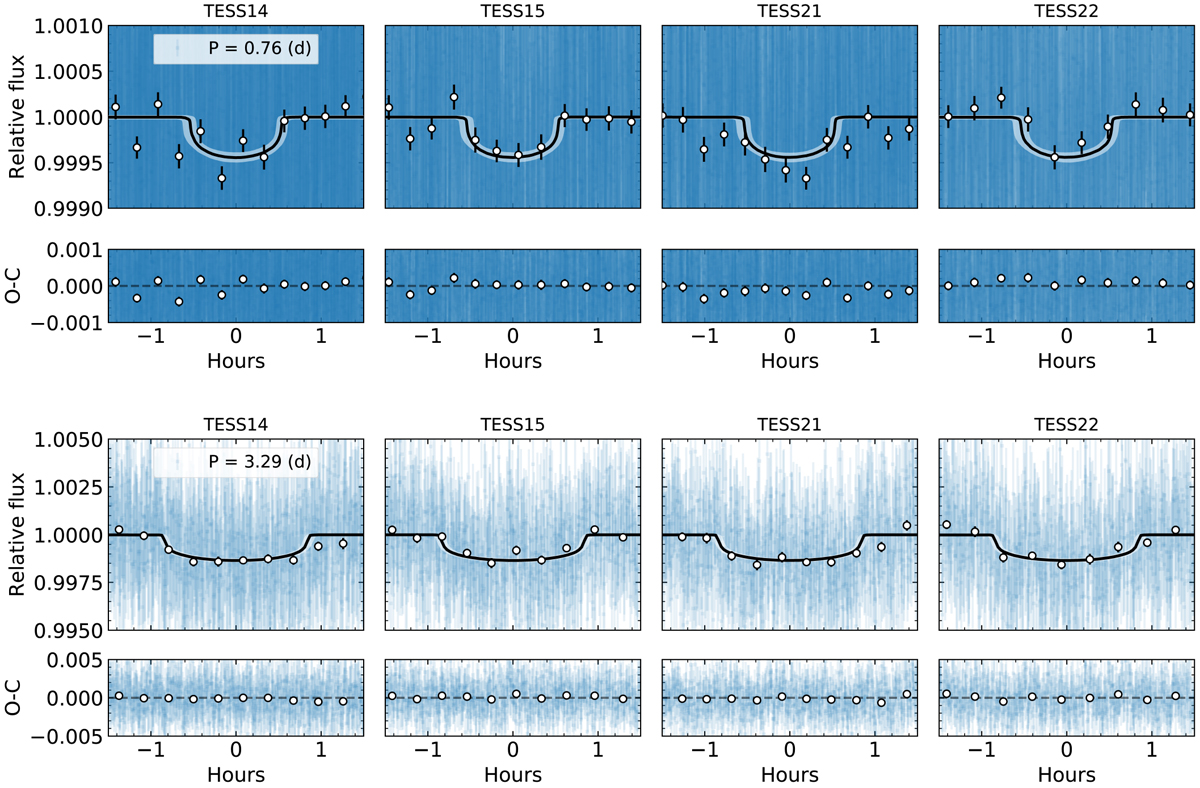
TESS LCs (blue points) folded in phase with the orbital periods of the transiting planets per sector. The best joint fit solution is plotted as a black line. The white dots correspond to the binned photometric data. The x axis represents the time computed from the mid-transit times as derived from the best joint fit.
Current usage metrics show cumulative count of Article Views (full-text article views including HTML views, PDF and ePub downloads, according to the available data) and Abstracts Views on Vision4Press platform.
Data correspond to usage on the plateform after 2015. The current usage metrics is available 48-96 hours after online publication and is updated daily on week days.
Initial download of the metrics may take a while.