Fig. A.2
Download original image
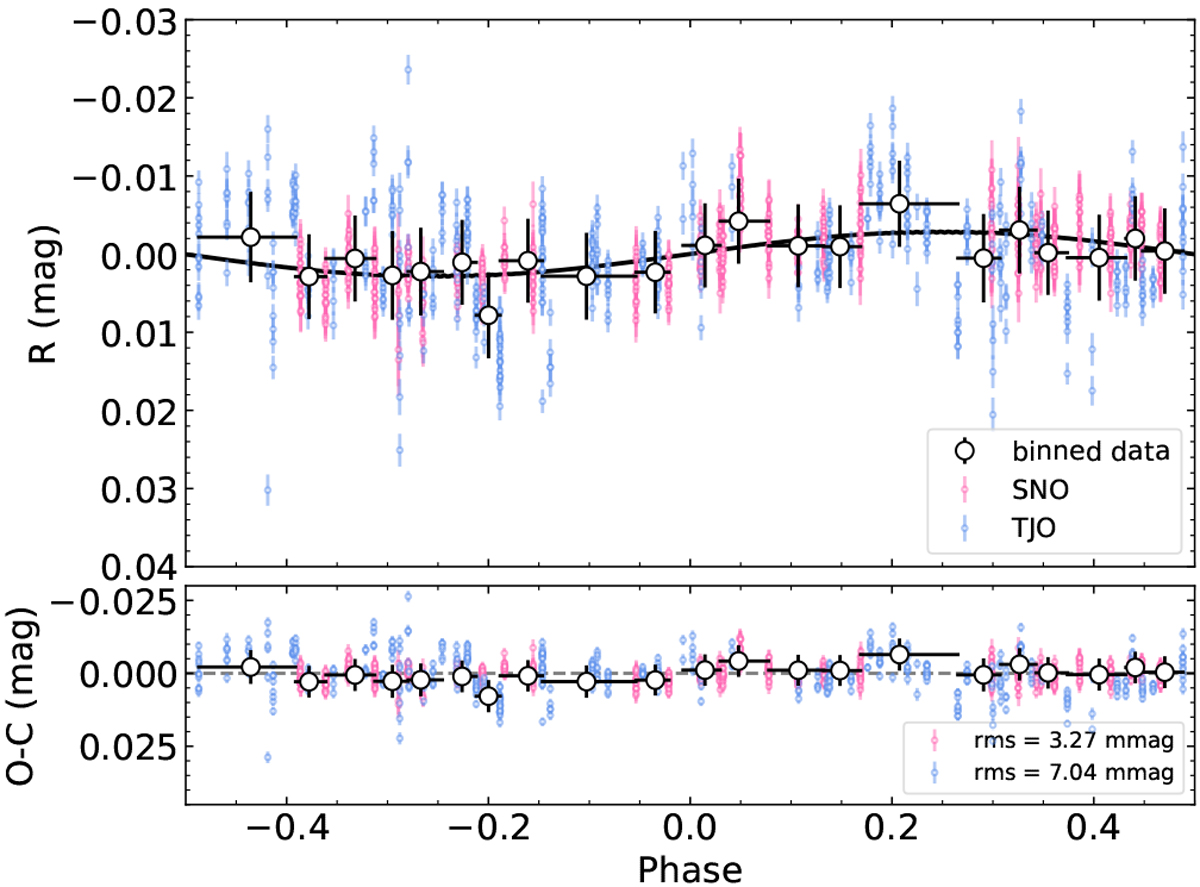
TJO and SNO R-band LCs folded in phase with the period Prot = 40.3 d (top panel). Residuals (observations minus model) are shown in the bottom panel. The white dots correspond to the binned data, where the x-error bars illustrate the interval of the bins and the y-error bars take into account the uncertainties of the binned data.
Current usage metrics show cumulative count of Article Views (full-text article views including HTML views, PDF and ePub downloads, according to the available data) and Abstracts Views on Vision4Press platform.
Data correspond to usage on the plateform after 2015. The current usage metrics is available 48-96 hours after online publication and is updated daily on week days.
Initial download of the metrics may take a while.