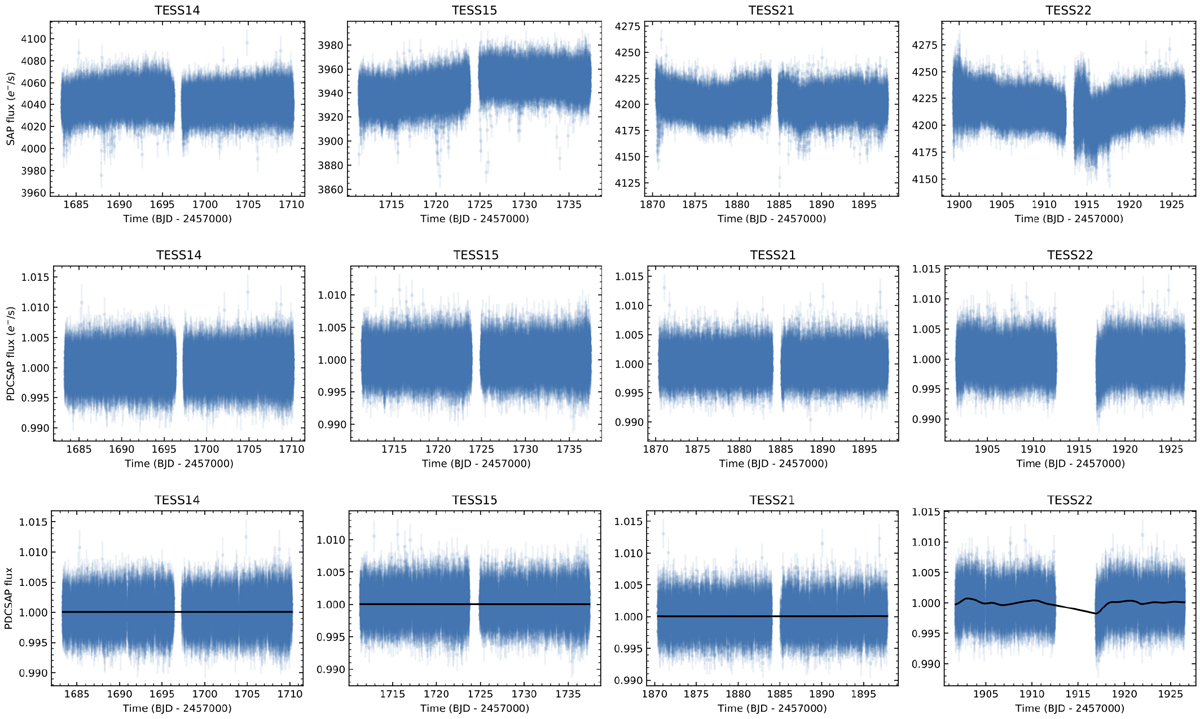
Fig. 2
Download original image
TESS LCs. Top and middle panels: SAP and PDCSAP LCs of TOI-1238 as obtained by TESS in sectors 14, 15, 21, and 22 and processed by SPOC (left to right). Bottom panel: PDCSAP LCs with the detrending GP models overplotted (black line). The GP models were used to remove any residual instrumental effect (after masking the position of all transits). As illustrated, only the data of sector 22 required this additional correction to produce a flat LC.
Current usage metrics show cumulative count of Article Views (full-text article views including HTML views, PDF and ePub downloads, according to the available data) and Abstracts Views on Vision4Press platform.
Data correspond to usage on the plateform after 2015. The current usage metrics is available 48-96 hours after online publication and is updated daily on week days.
Initial download of the metrics may take a while.