Fig. 10
Download original image
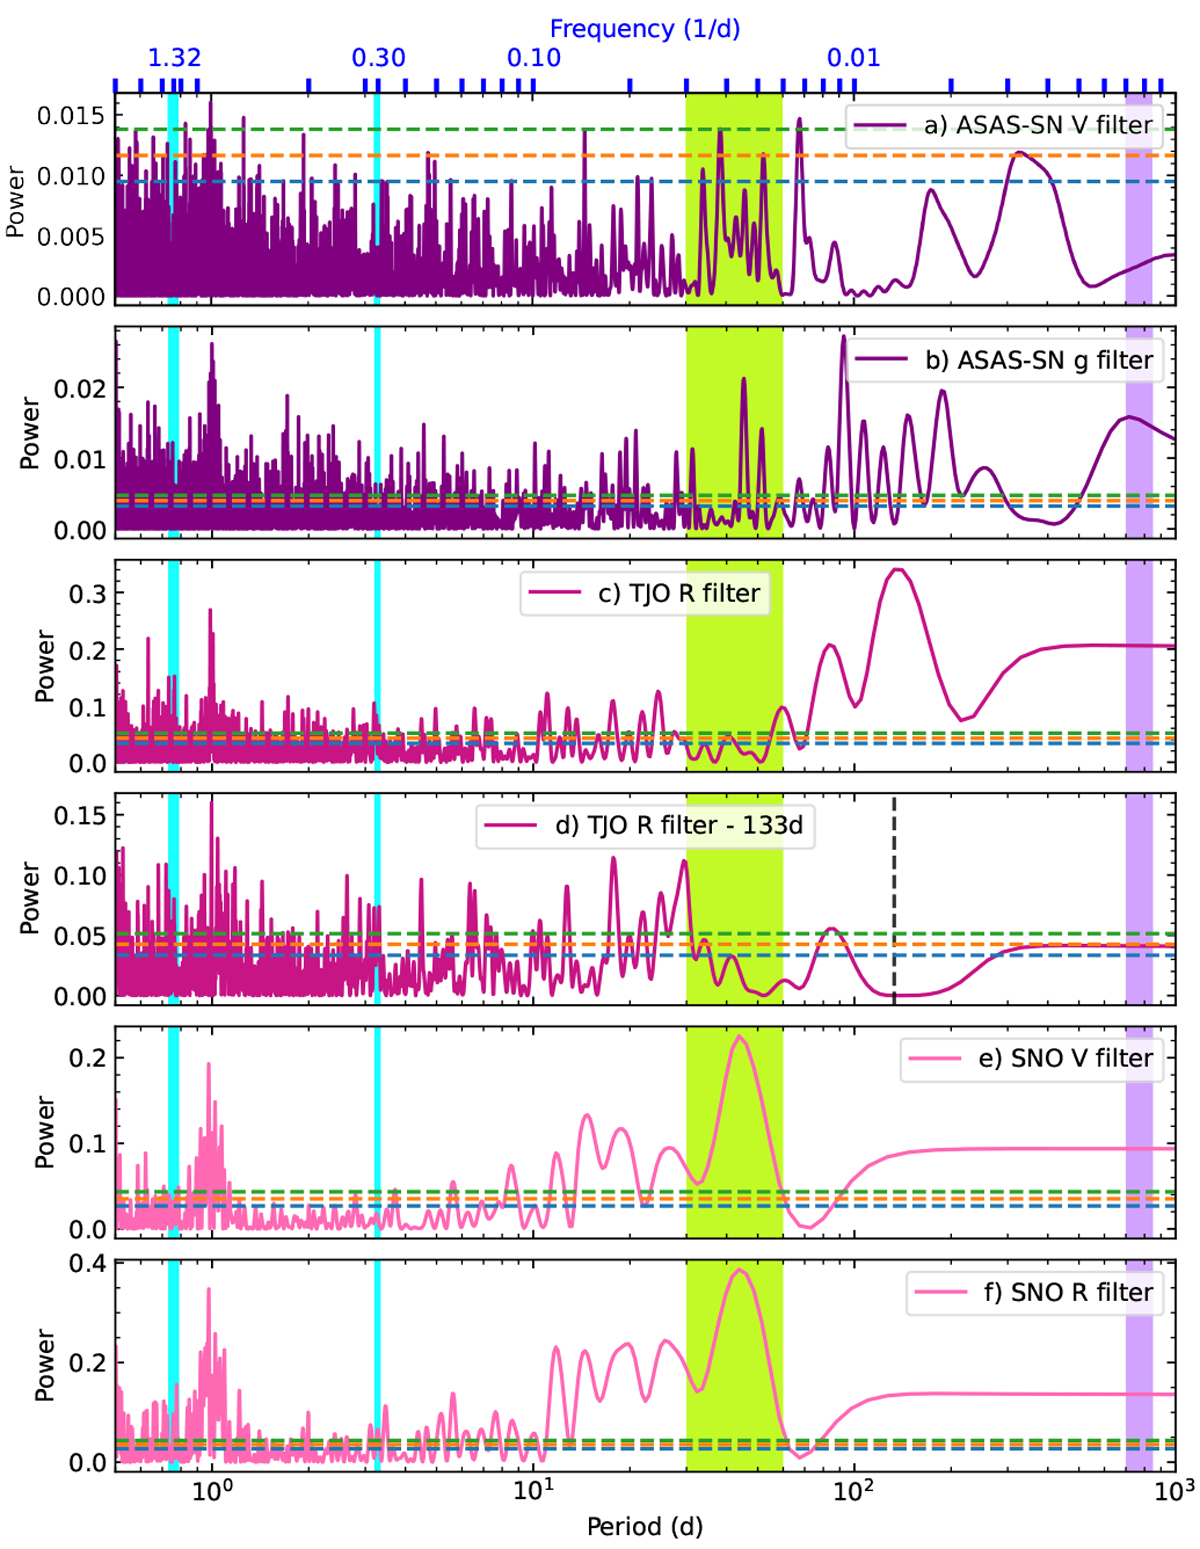
GLS periodograms of the ASAS-SN V and g, TJO R, and SNO V and R LCs shown in the time space between 0.5 and 1000 d. In all panels, the horizontal dashed lines indicate FAP levels of 10 (blue), 1 (orange), and 0.1% (green). The orbital periods of the two transiting planets are marked with vertical blue lines. The highest peak of the CARMENES RV GLS periodogram is shown with a violet line. The greenish band indicates the region where most of the spectroscopic activity indicators have their highest GLS peaks. In the fourth panel, the vertical dashed line indicates the periodicity of the signal removed from the data (see text).
Current usage metrics show cumulative count of Article Views (full-text article views including HTML views, PDF and ePub downloads, according to the available data) and Abstracts Views on Vision4Press platform.
Data correspond to usage on the plateform after 2015. The current usage metrics is available 48-96 hours after online publication and is updated daily on week days.
Initial download of the metrics may take a while.