Free Access
Fig. 9.
Download original image
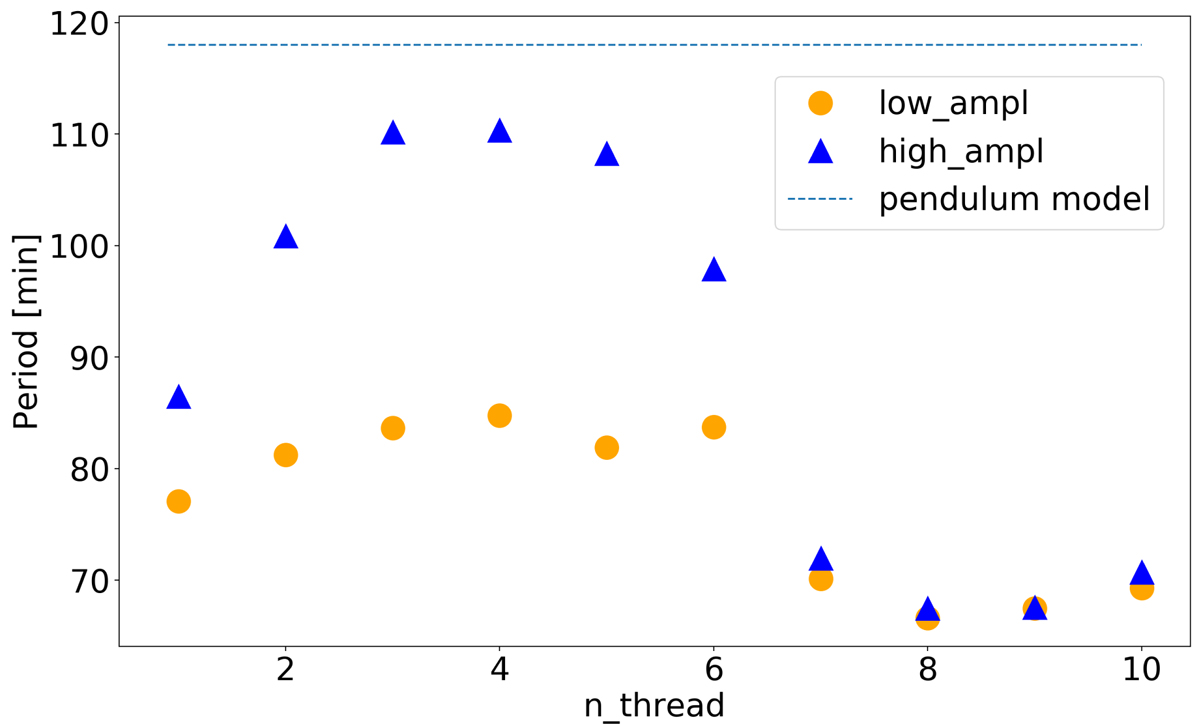
Values of period calculated by fitting function f(t) (Eq. (9)) to ![]() , for each thread (1–10). The circles represent values for low_ampl while the triangles represent values for high_ampl and the dashed horizontal line denotes value of period that we expect from the pendulum model.
, for each thread (1–10). The circles represent values for low_ampl while the triangles represent values for high_ampl and the dashed horizontal line denotes value of period that we expect from the pendulum model.
Current usage metrics show cumulative count of Article Views (full-text article views including HTML views, PDF and ePub downloads, according to the available data) and Abstracts Views on Vision4Press platform.
Data correspond to usage on the plateform after 2015. The current usage metrics is available 48-96 hours after online publication and is updated daily on week days.
Initial download of the metrics may take a while.