Free Access
Fig. 7.
Download original image
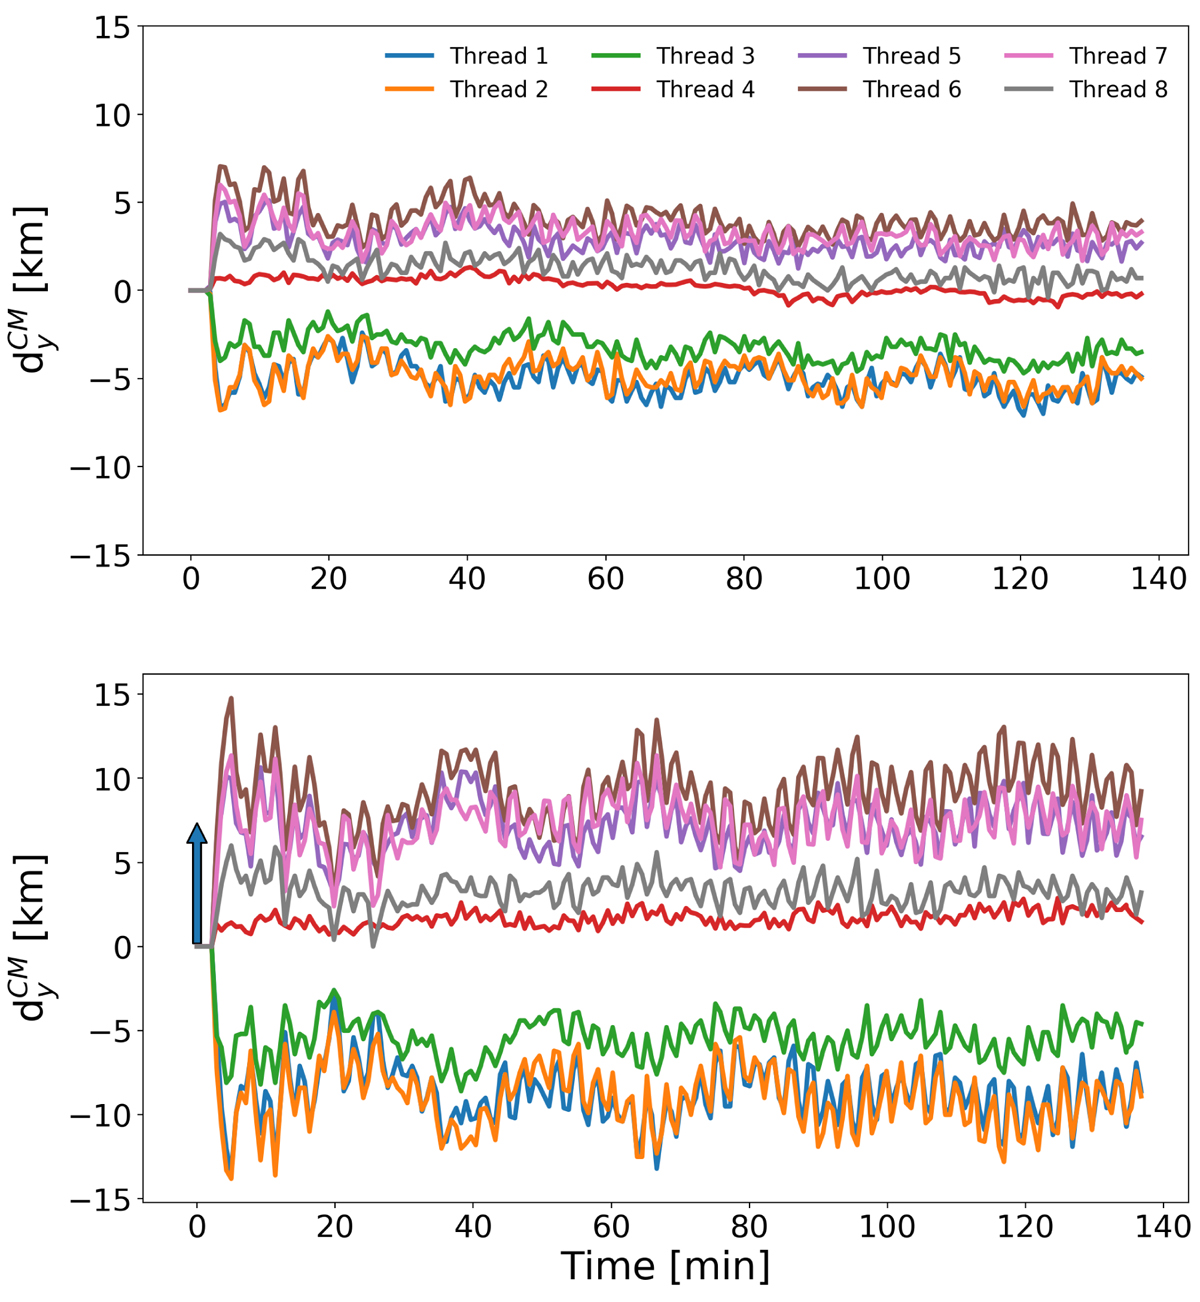
Evolution of motion of the CM coordinate in the y direction of threads 1–8 (transverse displacement) in respect to their initial position. The top plot shows ![]() for low_ampl case and the bottom plot for the high_ampl case. The arrow on the bottom plot marks the size of the cell in the y direction (7.5 km).
for low_ampl case and the bottom plot for the high_ampl case. The arrow on the bottom plot marks the size of the cell in the y direction (7.5 km).
Current usage metrics show cumulative count of Article Views (full-text article views including HTML views, PDF and ePub downloads, according to the available data) and Abstracts Views on Vision4Press platform.
Data correspond to usage on the plateform after 2015. The current usage metrics is available 48-96 hours after online publication and is updated daily on week days.
Initial download of the metrics may take a while.