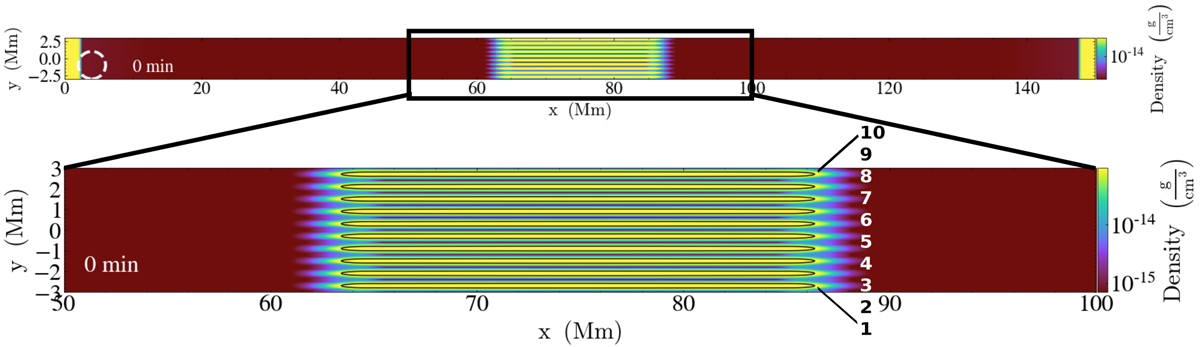
Fig. 1.
Download original image
Density plot of the domain (at t = 0), with the dashed circle denoting the area where we increase the energy (source region). We note that the variation along x is actually a variation along magnetic field lines, which have the prescribed shape as shown in Fig. 2. The bottom of the figure represents a cut-out focusing on the area of the threads located at the center of the domain. The contour lines mark the area with number density higher than 5 × 1010 cm−3 (where the plotted density is ρ = 1.4 mp nH). We label the threads with the numbers 1–10 and refer to them as such throughout the paper.
Current usage metrics show cumulative count of Article Views (full-text article views including HTML views, PDF and ePub downloads, according to the available data) and Abstracts Views on Vision4Press platform.
Data correspond to usage on the plateform after 2015. The current usage metrics is available 48-96 hours after online publication and is updated daily on week days.
Initial download of the metrics may take a while.