Fig. 4
Download original image
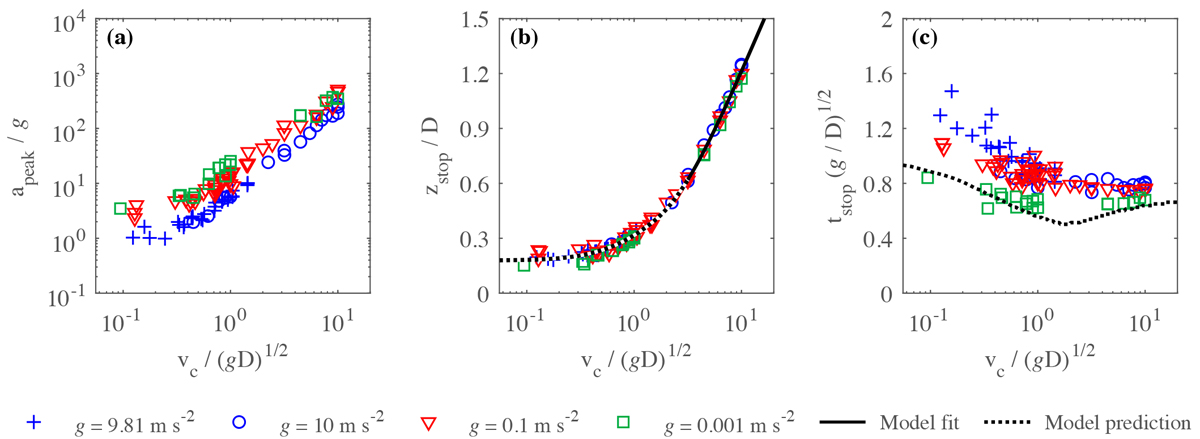
Collision behavior for a 1 kg, 10 cm diameter spherical projectile as a function of the Froude number for different gravity levels, where apeak is the peak acceleration, zstop is the penetration depth, tstop is the collision duration, g is gravity, and D is the projectile diameter. The solid line in plot (b) represents the least-squares fit to Eq. (8) when 3 < Fr < 10. The dotted line in plot (b) represents the model prediction based on Eqs. (7) and (8), and the dotted line in plot (c) represents the model prediction obtained through numerical integration of Eq. (1). Plot (a) is shown on a log-log scale for direct comparison with Fig. 3a.
Current usage metrics show cumulative count of Article Views (full-text article views including HTML views, PDF and ePub downloads, according to the available data) and Abstracts Views on Vision4Press platform.
Data correspond to usage on the plateform after 2015. The current usage metrics is available 48-96 hours after online publication and is updated daily on week days.
Initial download of the metrics may take a while.