Fig. 2
Download original image
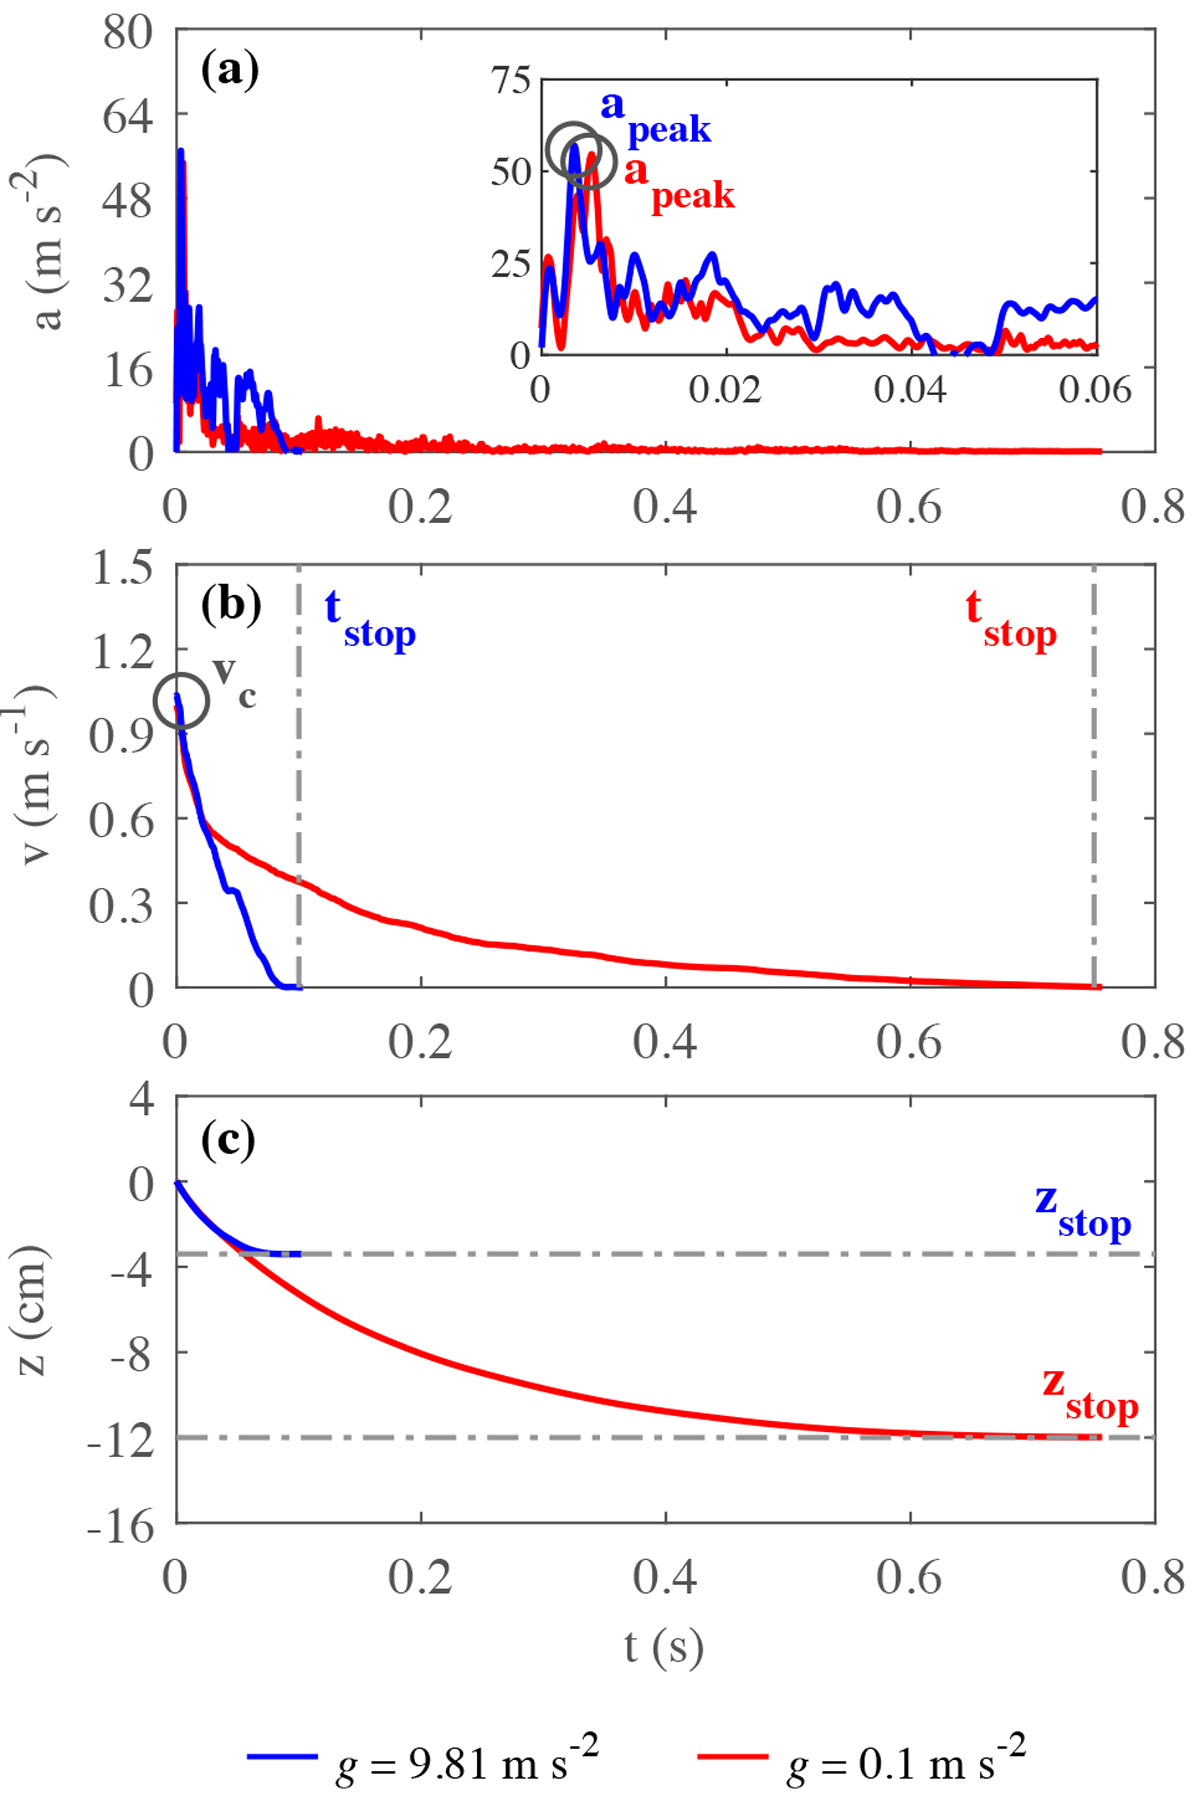
Acceleration, velocity, and position profiles for example impact simulations where g = 9.81 m s−2 (blue) and g = 0.1 m s−2 (red). For both test cases, the collision velocity of the projectile is 1 m s−1. The projectile’s approximate collision velocity vc, peak acceleration apeak, penetration depth zstop, and collision duration tstop are indicated by the circles, dashed lines, and text annotations on the plot.
Current usage metrics show cumulative count of Article Views (full-text article views including HTML views, PDF and ePub downloads, according to the available data) and Abstracts Views on Vision4Press platform.
Data correspond to usage on the plateform after 2015. The current usage metrics is available 48-96 hours after online publication and is updated daily on week days.
Initial download of the metrics may take a while.