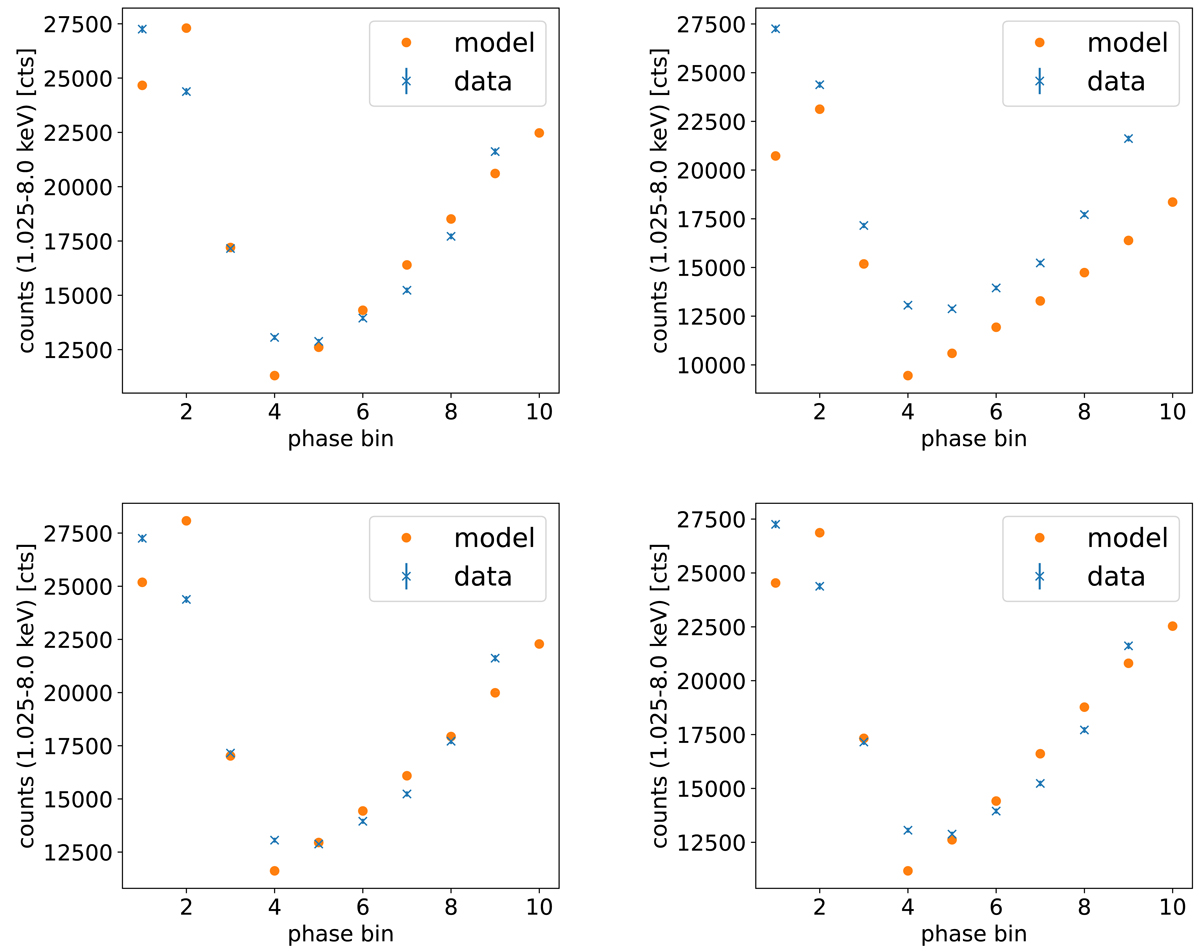
Fig. 3.
Download original image
Observed (blue crosses) and theoretical (orange circles) 0.5–8 keV pulse diagrams of the best-fit blackbody model (top left), magnetized atmosphere model (top right), free-ions condensed surface (bottom left), and fixed-ions condensed surface (bottom right). The XMM-Newton data are shown with error bars which are so small that they cannot be seen for most data points.
Current usage metrics show cumulative count of Article Views (full-text article views including HTML views, PDF and ePub downloads, according to the available data) and Abstracts Views on Vision4Press platform.
Data correspond to usage on the plateform after 2015. The current usage metrics is available 48-96 hours after online publication and is updated daily on week days.
Initial download of the metrics may take a while.