Fig. 6.
Download original image
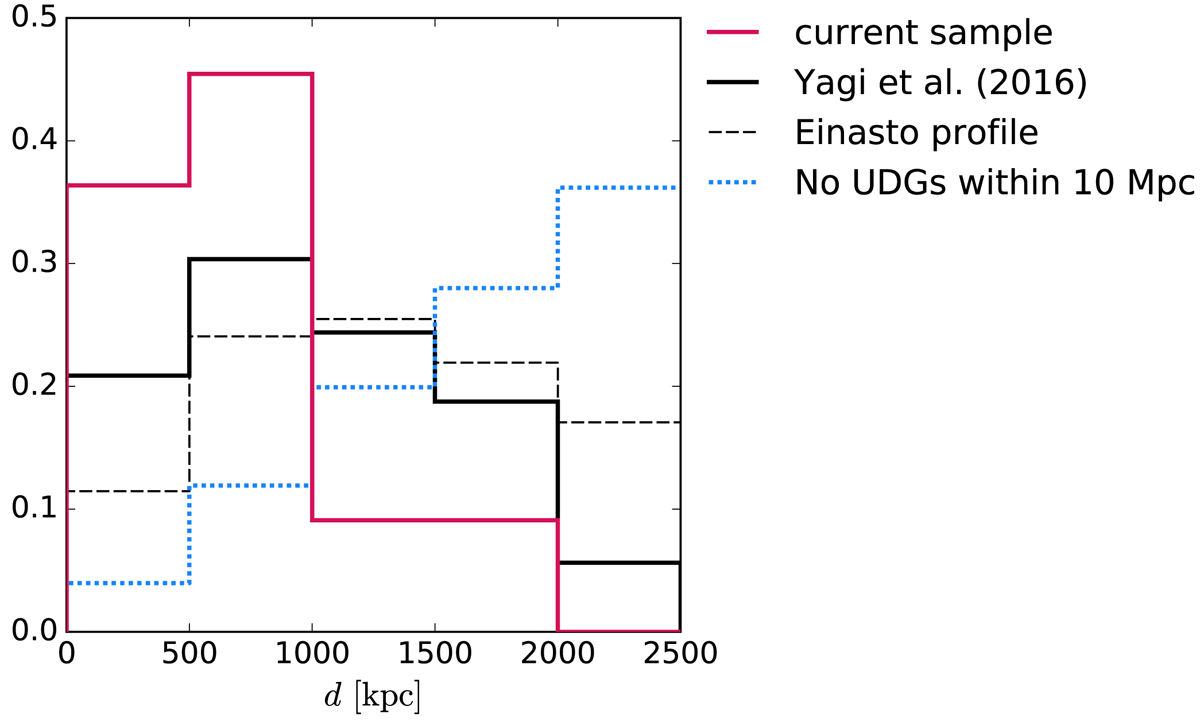
Distribution of the projected distance of the sample UDGs (plain red) and of the parent Yagi et al. (2016) Coma cluster UDG catalogue (plain black) compared to the average Einasto profile derived by van der Burg et al. (2016, dashed black) and a distribution with no UDGs within 10 Mpc (dotted blue). A constant UDG density within 10 Mpc would closely follow the latter, given the x-axis range. The van der Burg et al. (2016) Einasto distribution provides a reasonable fit to the Coma cluster UDGs; a distribution without UDGs within 10 Mpc or with a constant UDG density are disfavoured.
Current usage metrics show cumulative count of Article Views (full-text article views including HTML views, PDF and ePub downloads, according to the available data) and Abstracts Views on Vision4Press platform.
Data correspond to usage on the plateform after 2015. The current usage metrics is available 48-96 hours after online publication and is updated daily on week days.
Initial download of the metrics may take a while.