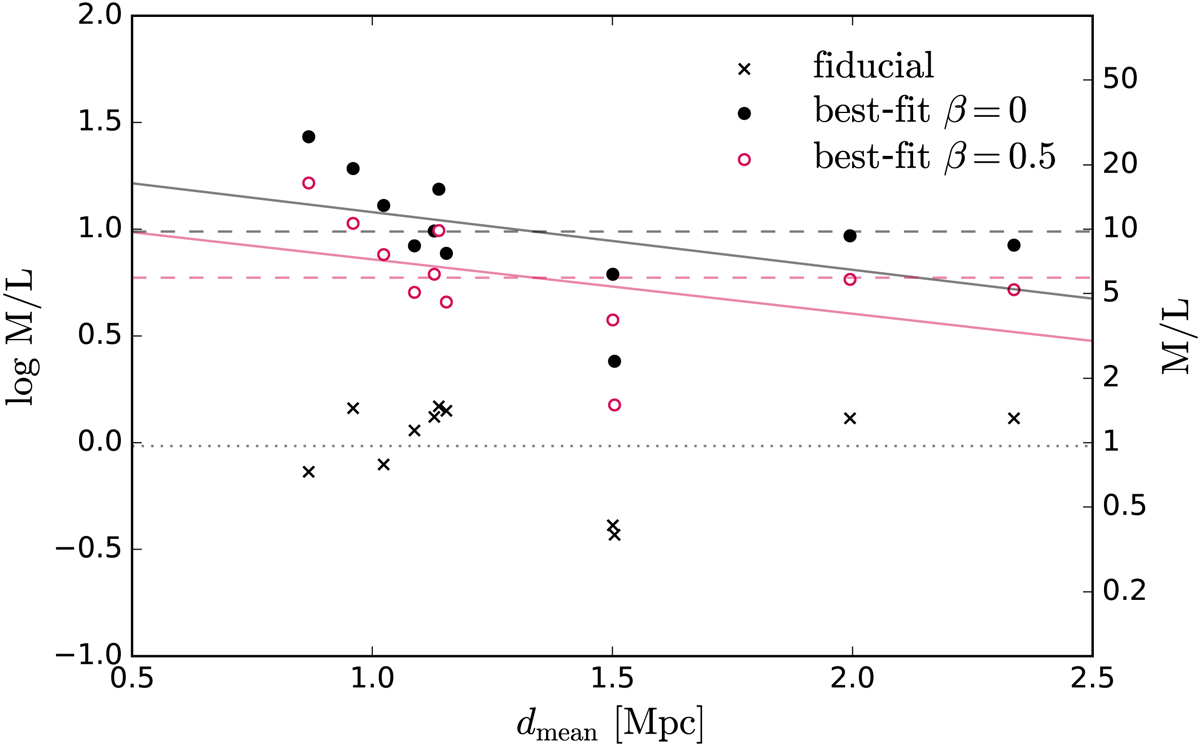
Fig. 11.
Download original image
Best-fit M/L ratio matching the effective velocity dispersion σeff, assuming MOND with EFE at the average distance dmean. Crosses correspond to the fiducial M/L ratio values from Table 1, plain black circles to the best-fit values with an anisotropy parameter β = 0, and open magenta circles to the best-fit values with β = 0.5. Plain lines correspond to linear fits, dashed and dotted lines to the averages. The average best-fit M/L ratio is 11.5 with β = 0 and 7.0 with β = +0.5. The fits with β = +0.5 are displayed in Fig. C.1.
Current usage metrics show cumulative count of Article Views (full-text article views including HTML views, PDF and ePub downloads, according to the available data) and Abstracts Views on Vision4Press platform.
Data correspond to usage on the plateform after 2015. The current usage metrics is available 48-96 hours after online publication and is updated daily on week days.
Initial download of the metrics may take a while.