Fig. 10.
Download original image
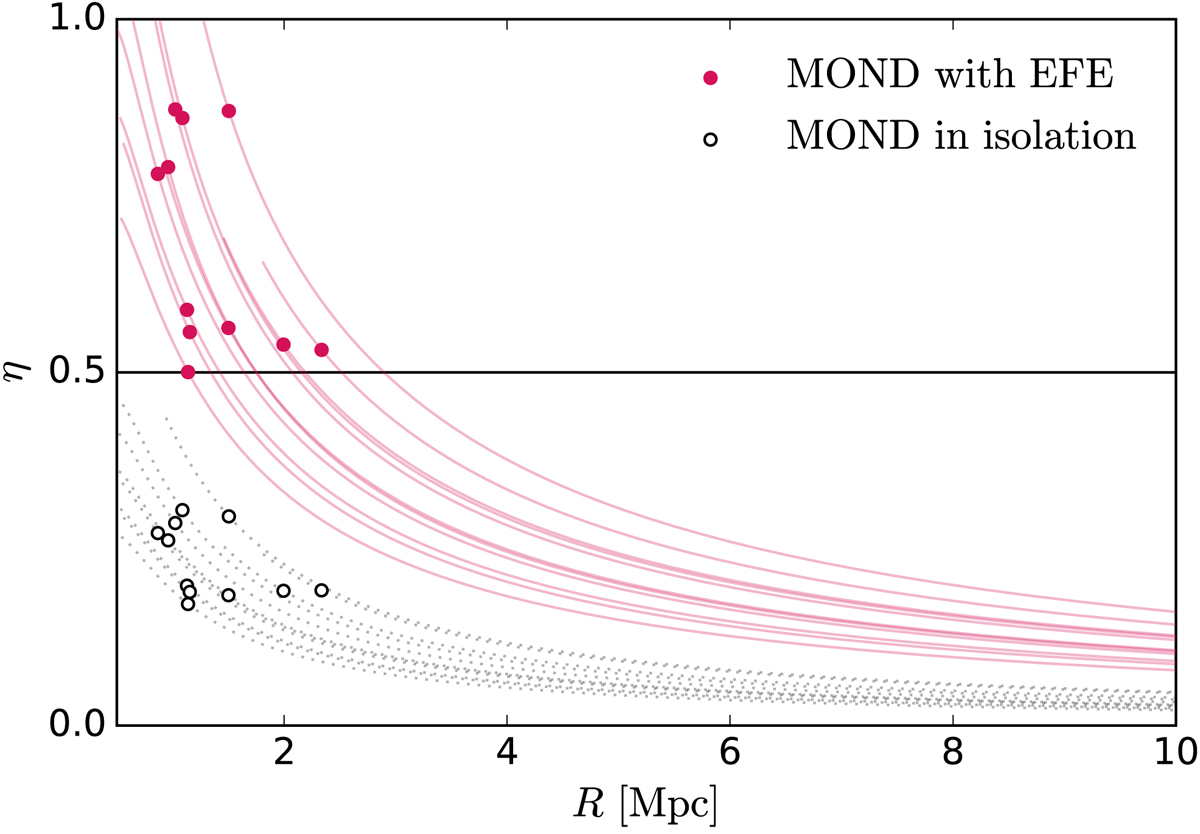
Tidal susceptibility η as a function of the distance R from the centre of the Coma cluster for the sample UDGs. The distance is assumed to be larger than the projected distance d, i.e., R > d. Points correspond to the average distance dmean assuming the van der Burg et al. (2016) Einasto UDG distribution (cf. Sect. 4.1): plain magenta for MOND with EFE, open black for MOND in isolation.
Current usage metrics show cumulative count of Article Views (full-text article views including HTML views, PDF and ePub downloads, according to the available data) and Abstracts Views on Vision4Press platform.
Data correspond to usage on the plateform after 2015. The current usage metrics is available 48-96 hours after online publication and is updated daily on week days.
Initial download of the metrics may take a while.