Fig. 9.
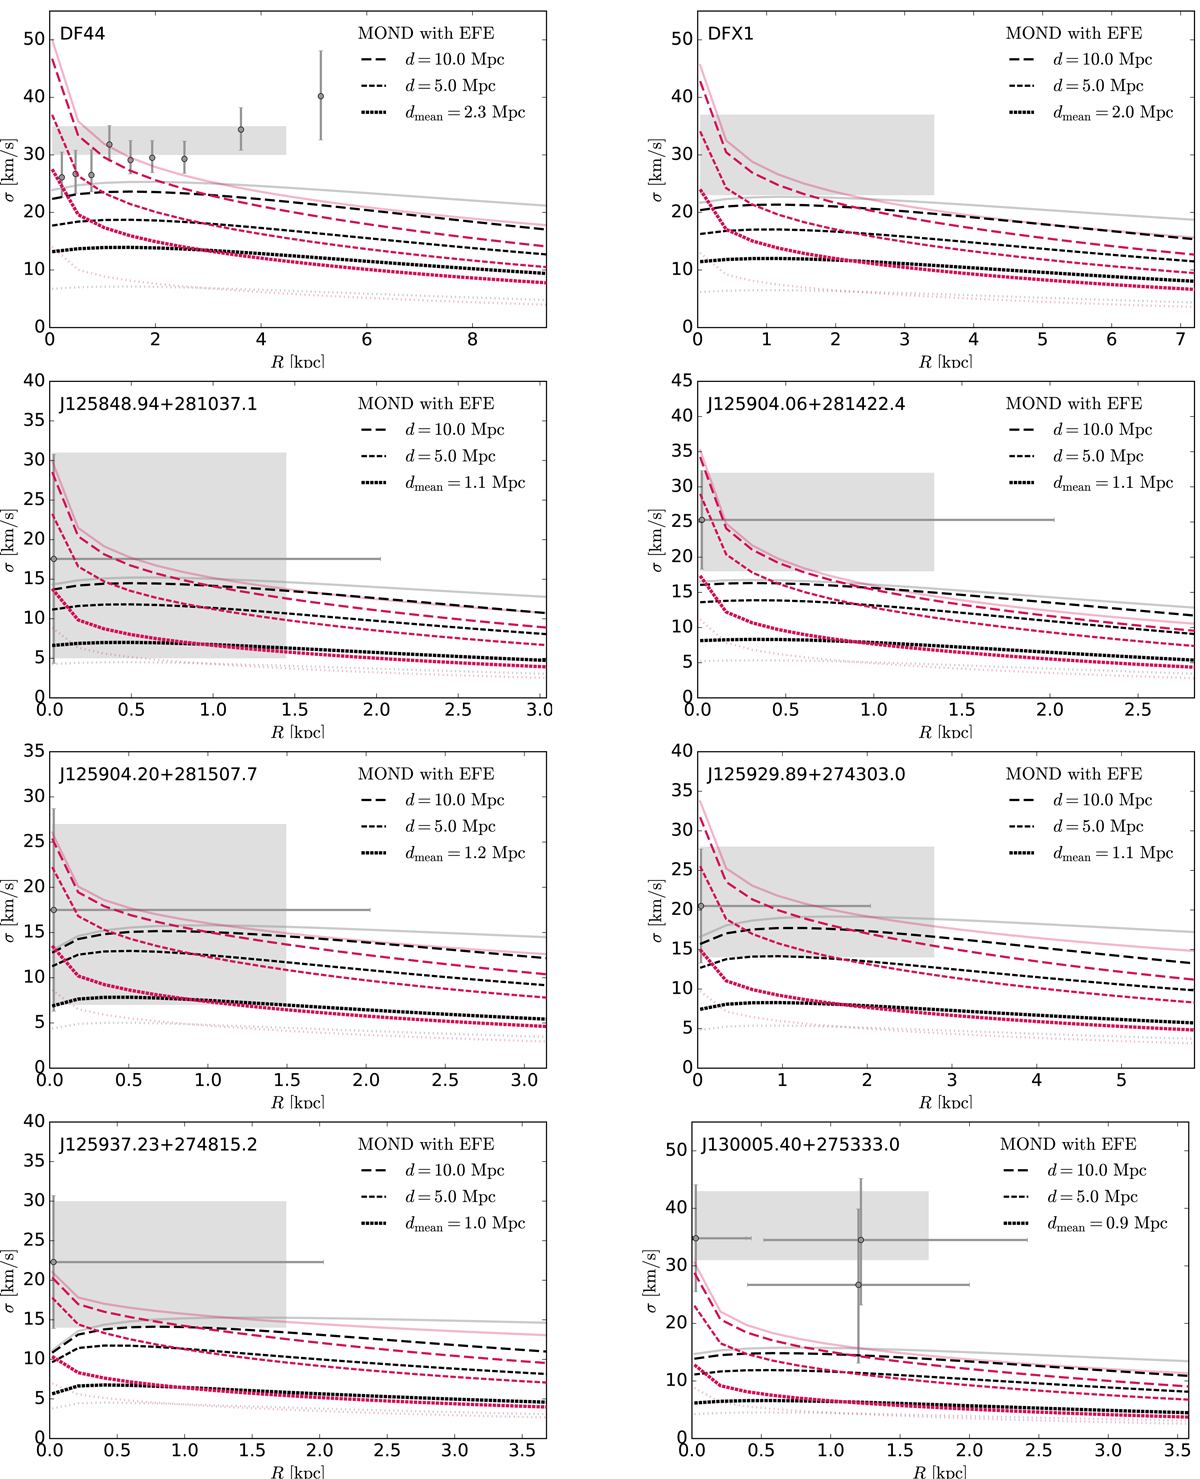
Download original image
Comparison between the measured line-of-sight velocity dispersion of the sample UDGs (grey error bars and/or shaded area) and the MOND prediction at different distances from the cluster centre. Black lines correspond to a uniform anisotropy parameter β = 0 (isotropic), decreasing magenta lines to β = +0.5 (radially biased). The plain and dotted light grey (red) lines recall the predicted isotropic (radially-biased) velocity dispersion profiles in the isolated MOND and Newtonian cases, respectively (cf. Fig. 4). Data points stem from van Dokkum et al. (2019b) for DF44, van Dokkum et al. (2017) for DFX1, and from Chilingarian et al. (2019) for the other UDGs. The shaded area corresponds to the effective velocity dispersion or, when not available (in the case of DFX1), the central stellar velocity dispersion.
Current usage metrics show cumulative count of Article Views (full-text article views including HTML views, PDF and ePub downloads, according to the available data) and Abstracts Views on Vision4Press platform.
Data correspond to usage on the plateform after 2015. The current usage metrics is available 48-96 hours after online publication and is updated daily on week days.
Initial download of the metrics may take a while.