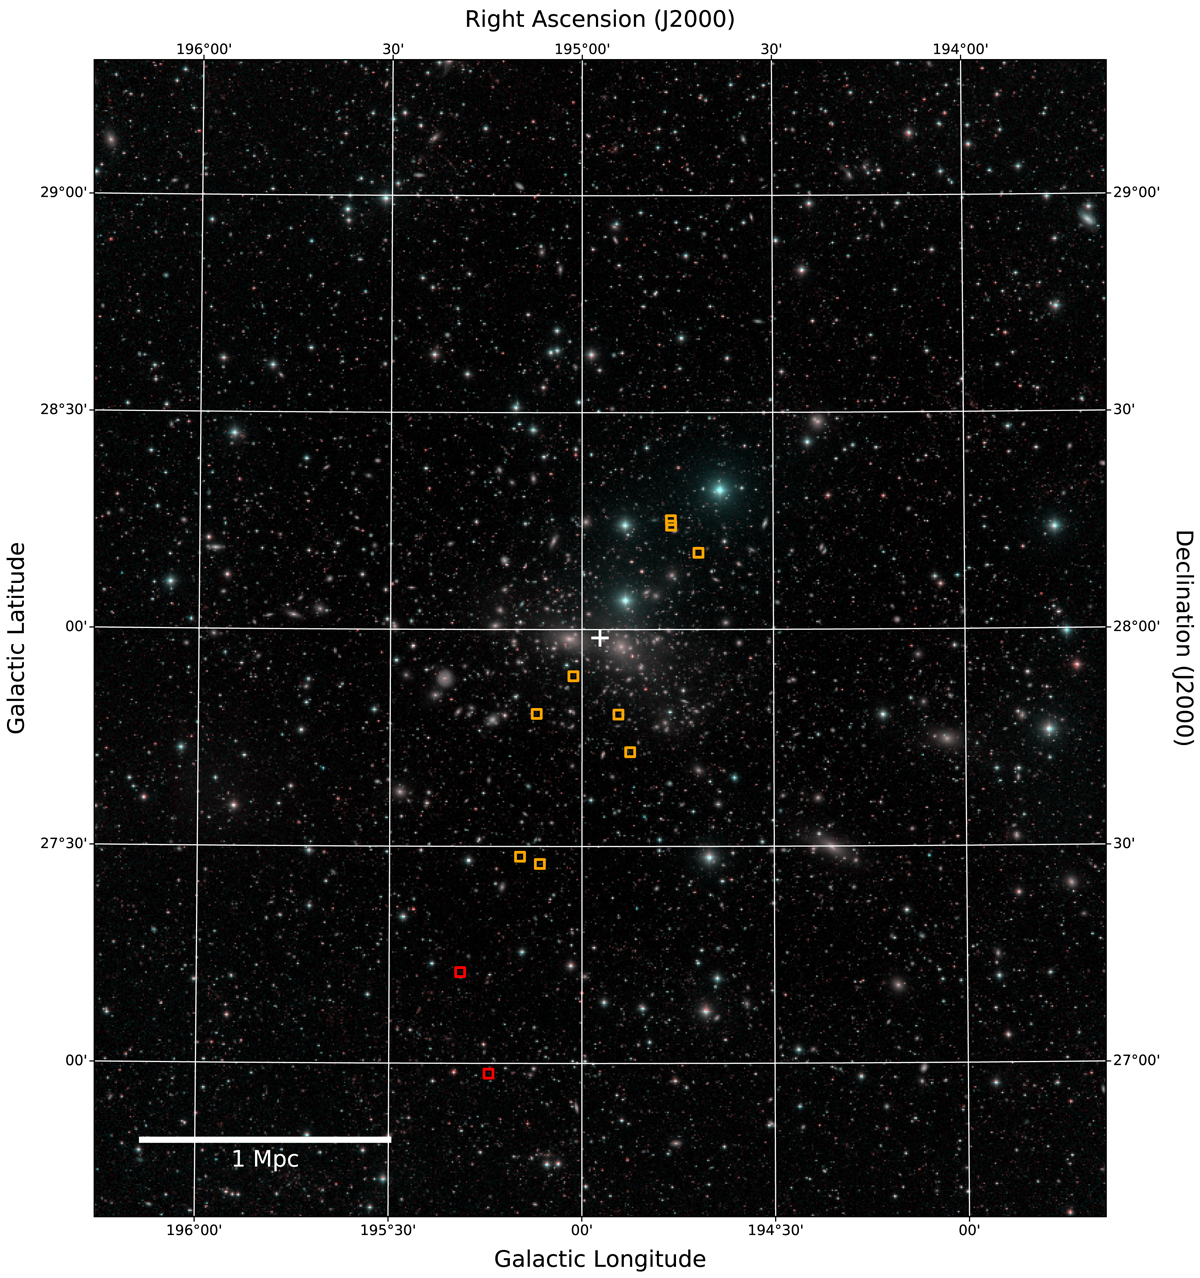
Fig. 1.
Download original image
Spatial distribution of the Coma cluster UDGs modelled in this article projected on a colour image of the cluster created from the Dragonfly g and r images (Abraham & van Dokkum 2014; van Dokkum et al. 2015a). The adopted centre of the Coma cluster is indicated by the white cross. DF44 and DFX1, which are the furthest away from the centre, are indicated in red, the Chilingarian et al. (2019) UDGs are displayed in orange.
Current usage metrics show cumulative count of Article Views (full-text article views including HTML views, PDF and ePub downloads, according to the available data) and Abstracts Views on Vision4Press platform.
Data correspond to usage on the plateform after 2015. The current usage metrics is available 48-96 hours after online publication and is updated daily on week days.
Initial download of the metrics may take a while.