Fig. 9
Download original image
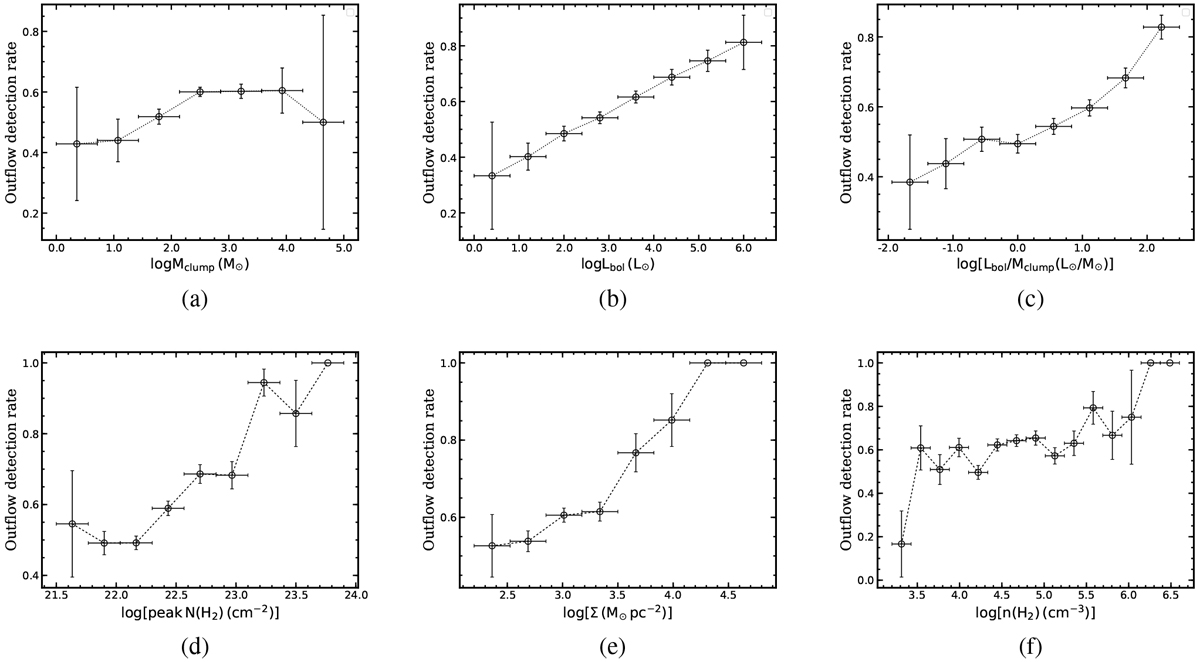
Outflow detection rate against the physical properties of clumps. Top left (a,b,c) to bottom right (d,e,f): detection rate as a function of clump mass Mclump (M⊙), bolometric luminosity of the central object Lbol∕L⊙, luminosity-to-mass ratio Lbol∕Mclump (L⊙∕M⊙), the peak H2 column density (peak N(H2) cm−2), the mean mass surface density Σ (M⊙ pc−2), and the mean volume H2 density n(H2) (cm−3) of clumps in logarithmic scales. The error bars on the x-axis and y-axis are determined following the same method in Fig. 6.
Current usage metrics show cumulative count of Article Views (full-text article views including HTML views, PDF and ePub downloads, according to the available data) and Abstracts Views on Vision4Press platform.
Data correspond to usage on the plateform after 2015. The current usage metrics is available 48-96 hours after online publication and is updated daily on week days.
Initial download of the metrics may take a while.