Fig. 8
Download original image
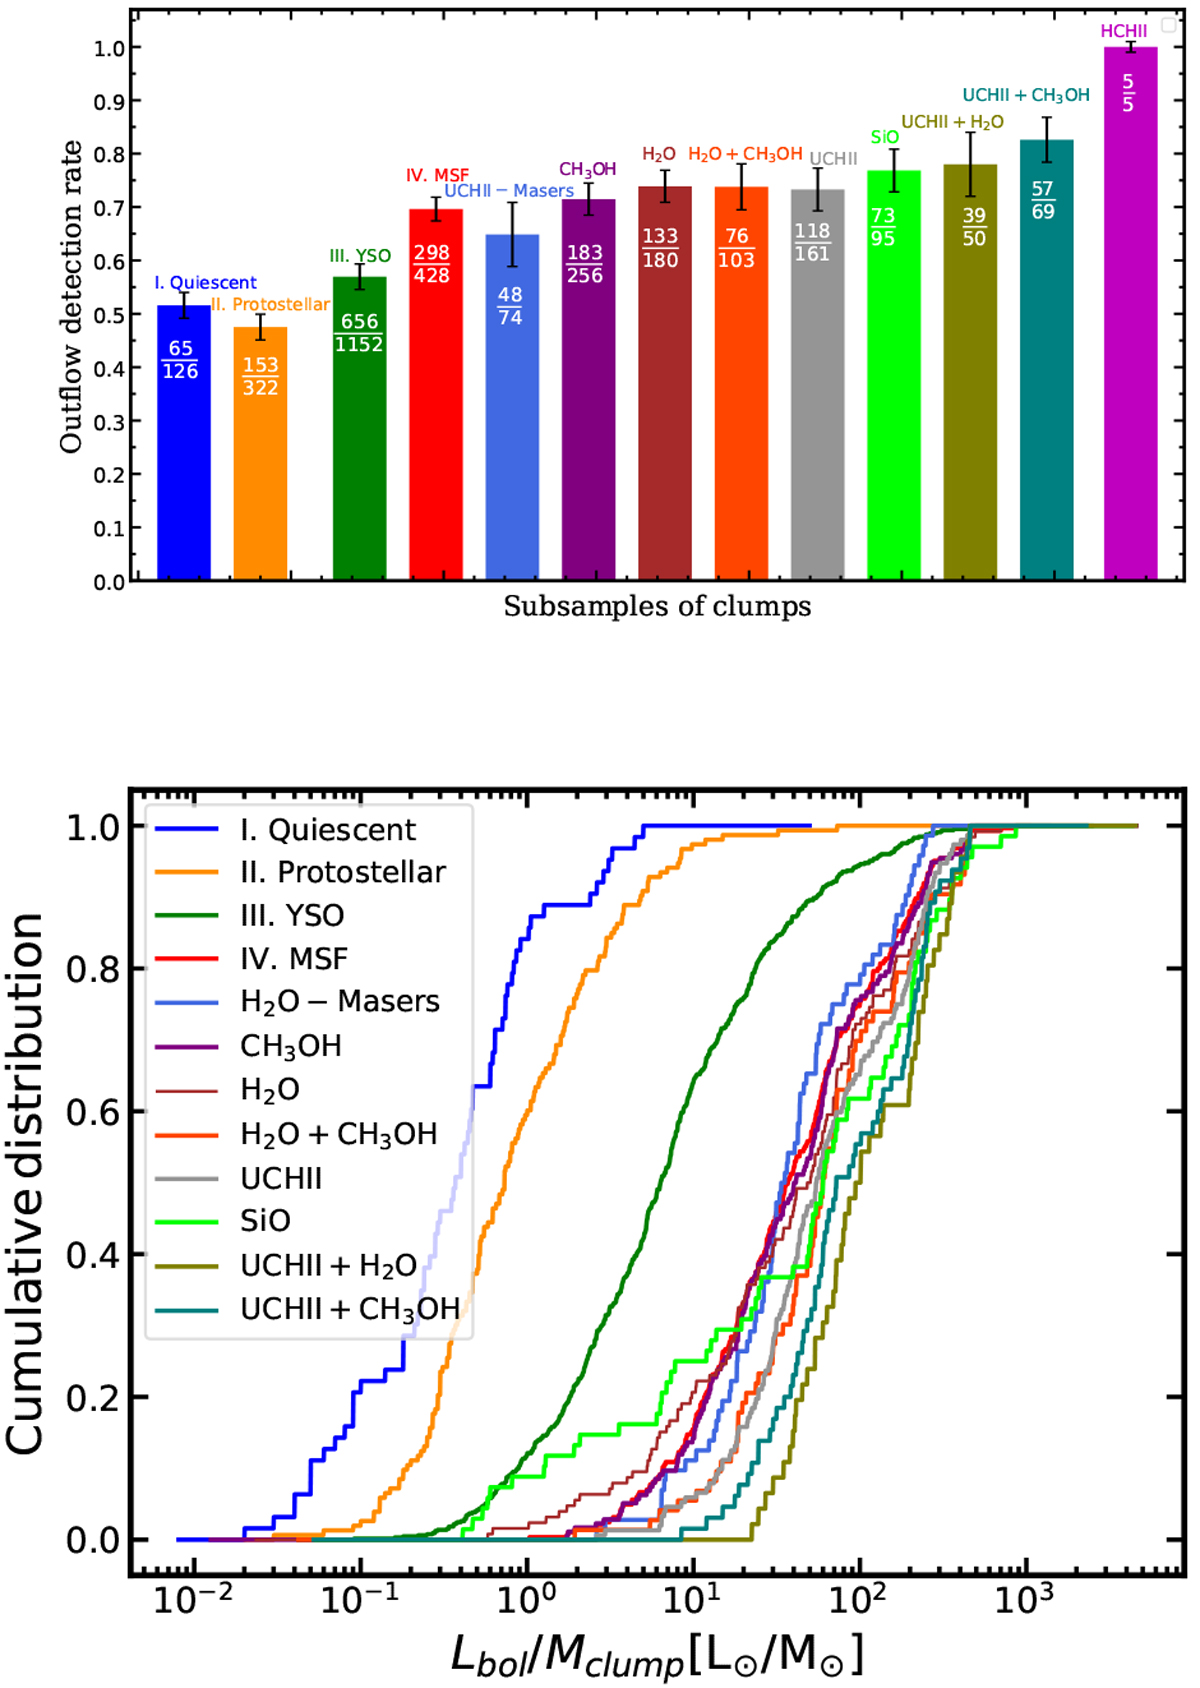
Distributions of outflow detection rates and luminosity-to-mass ratios for the different subsamples of clumps. Top panel: outflow detection rate of clumps in different evolutionary stages and associated with different star-forming activities, as presented in Table 4. The error bars of each group are calculated from the binomial errors and the error of the detection rate for clumps with HC H II regions is adopted from the binomial errors of the total clump sample. Bottom panel: cumulative distributions of luminosity-to-mass ratios (Lbol ∕Mclump) for the subsamples of outflow clumps in the top panel, which indicate the evolutionary stages of these subsamples.
Current usage metrics show cumulative count of Article Views (full-text article views including HTML views, PDF and ePub downloads, according to the available data) and Abstracts Views on Vision4Press platform.
Data correspond to usage on the plateform after 2015. The current usage metrics is available 48-96 hours after online publication and is updated daily on week days.
Initial download of the metrics may take a while.