Open Access
Fig. 7
Download original image
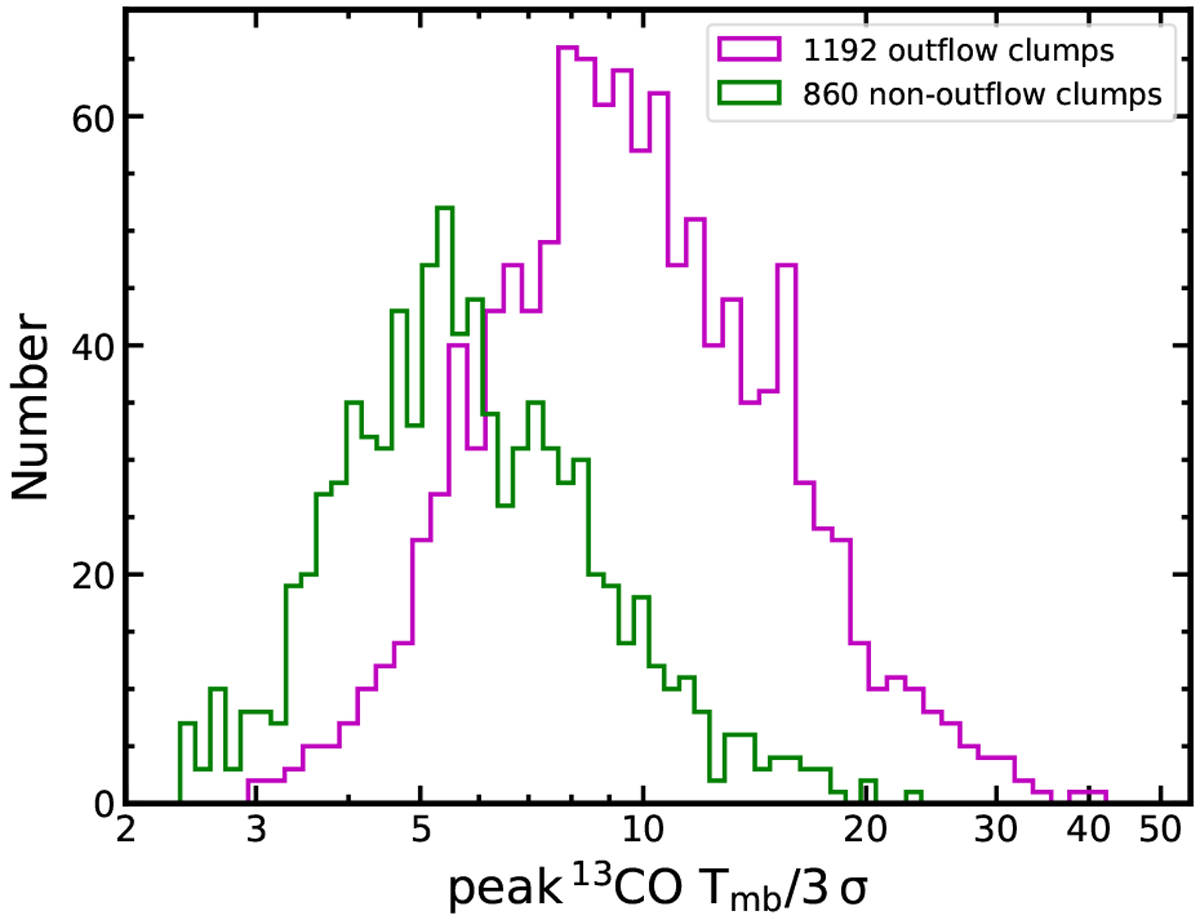
Distribution of the ratio between the peak intensity of the 13CO line and the 3σ detection level of the corresponding spectrum for the outflow sample (magenta histogram) and the non-outflow sample (green histogram).
Current usage metrics show cumulative count of Article Views (full-text article views including HTML views, PDF and ePub downloads, according to the available data) and Abstracts Views on Vision4Press platform.
Data correspond to usage on the plateform after 2015. The current usage metrics is available 48-96 hours after online publication and is updated daily on week days.
Initial download of the metrics may take a while.