Open Access
Fig. 5
Download original image
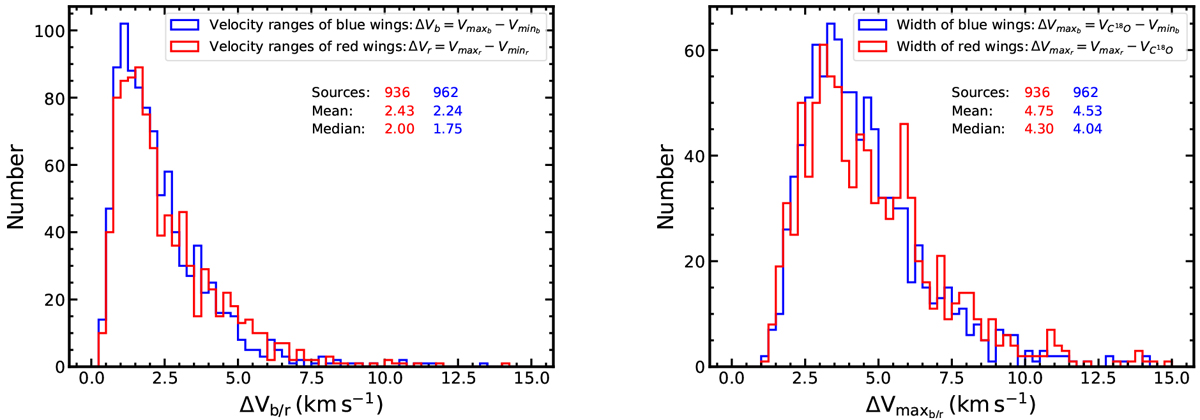
Distributions of velocity ranges ΔVb/r (left panel), maximum blue and red wing velocities ![]() (right panel) of the 1192 clumps with outflow wings, including 706 clumps with bipolar wings, and 486 clumps with unipolar wings.
(right panel) of the 1192 clumps with outflow wings, including 706 clumps with bipolar wings, and 486 clumps with unipolar wings.
Current usage metrics show cumulative count of Article Views (full-text article views including HTML views, PDF and ePub downloads, according to the available data) and Abstracts Views on Vision4Press platform.
Data correspond to usage on the plateform after 2015. The current usage metrics is available 48-96 hours after online publication and is updated daily on week days.
Initial download of the metrics may take a while.