Fig. 4
Download original image
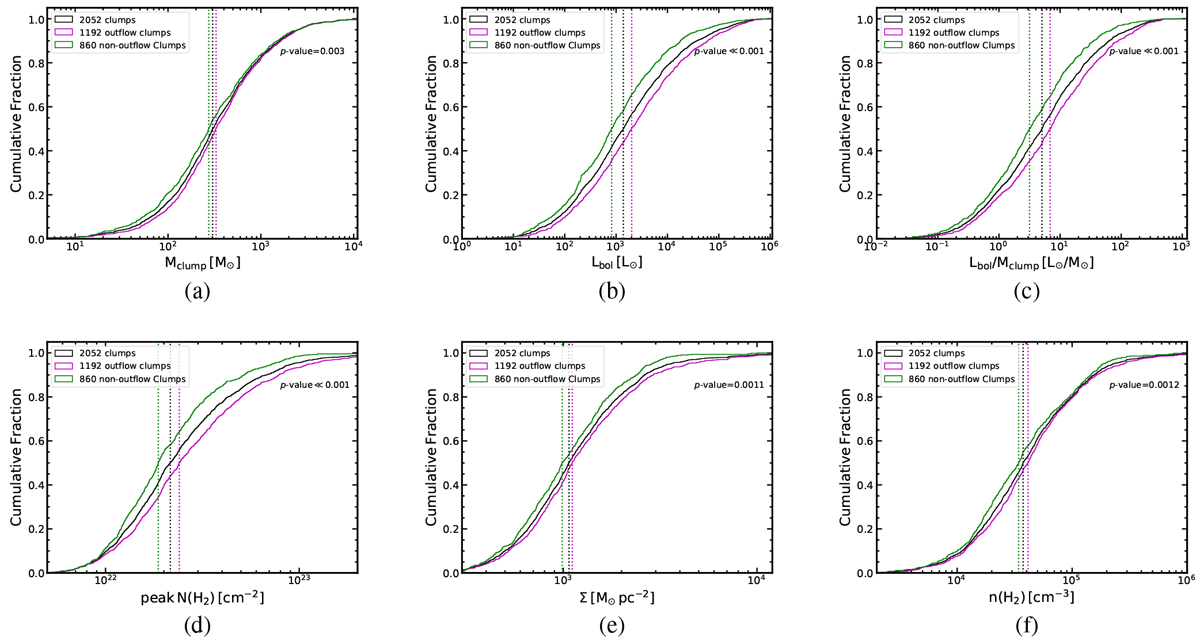
Cumulative distributions of the physical properties for the total 2052 clumps, the 1192 outflow clumps, and the 860 non-outflow clumps. Top left (a,b,c) to bottom right (d,e,f): cumulative distributions of clump mass (Mclump (M⊙)), bolometric luminosity of central objects (Lbol∕L⊙), luminosity-to-mass ratio (Lbol∕Mclump (L⊙∕M⊙)), the peak H2 column density (peak N(H2) cm−2), the mean mass surface density (Σ (M⊙ pc−2)), and the mean volume H2 density (n(H2) (cm−3)) of the total 2052 clumps (black lines), the 1192 outflow clumps (magenta lines), and the 860 non-outflow clumps (green lines). We present the median values of the three samples in vertical lines, and p-values of K–S testsbetween the outflow sample and the non-outflow in each plot.
Current usage metrics show cumulative count of Article Views (full-text article views including HTML views, PDF and ePub downloads, according to the available data) and Abstracts Views on Vision4Press platform.
Data correspond to usage on the plateform after 2015. The current usage metrics is available 48-96 hours after online publication and is updated daily on week days.
Initial download of the metrics may take a while.