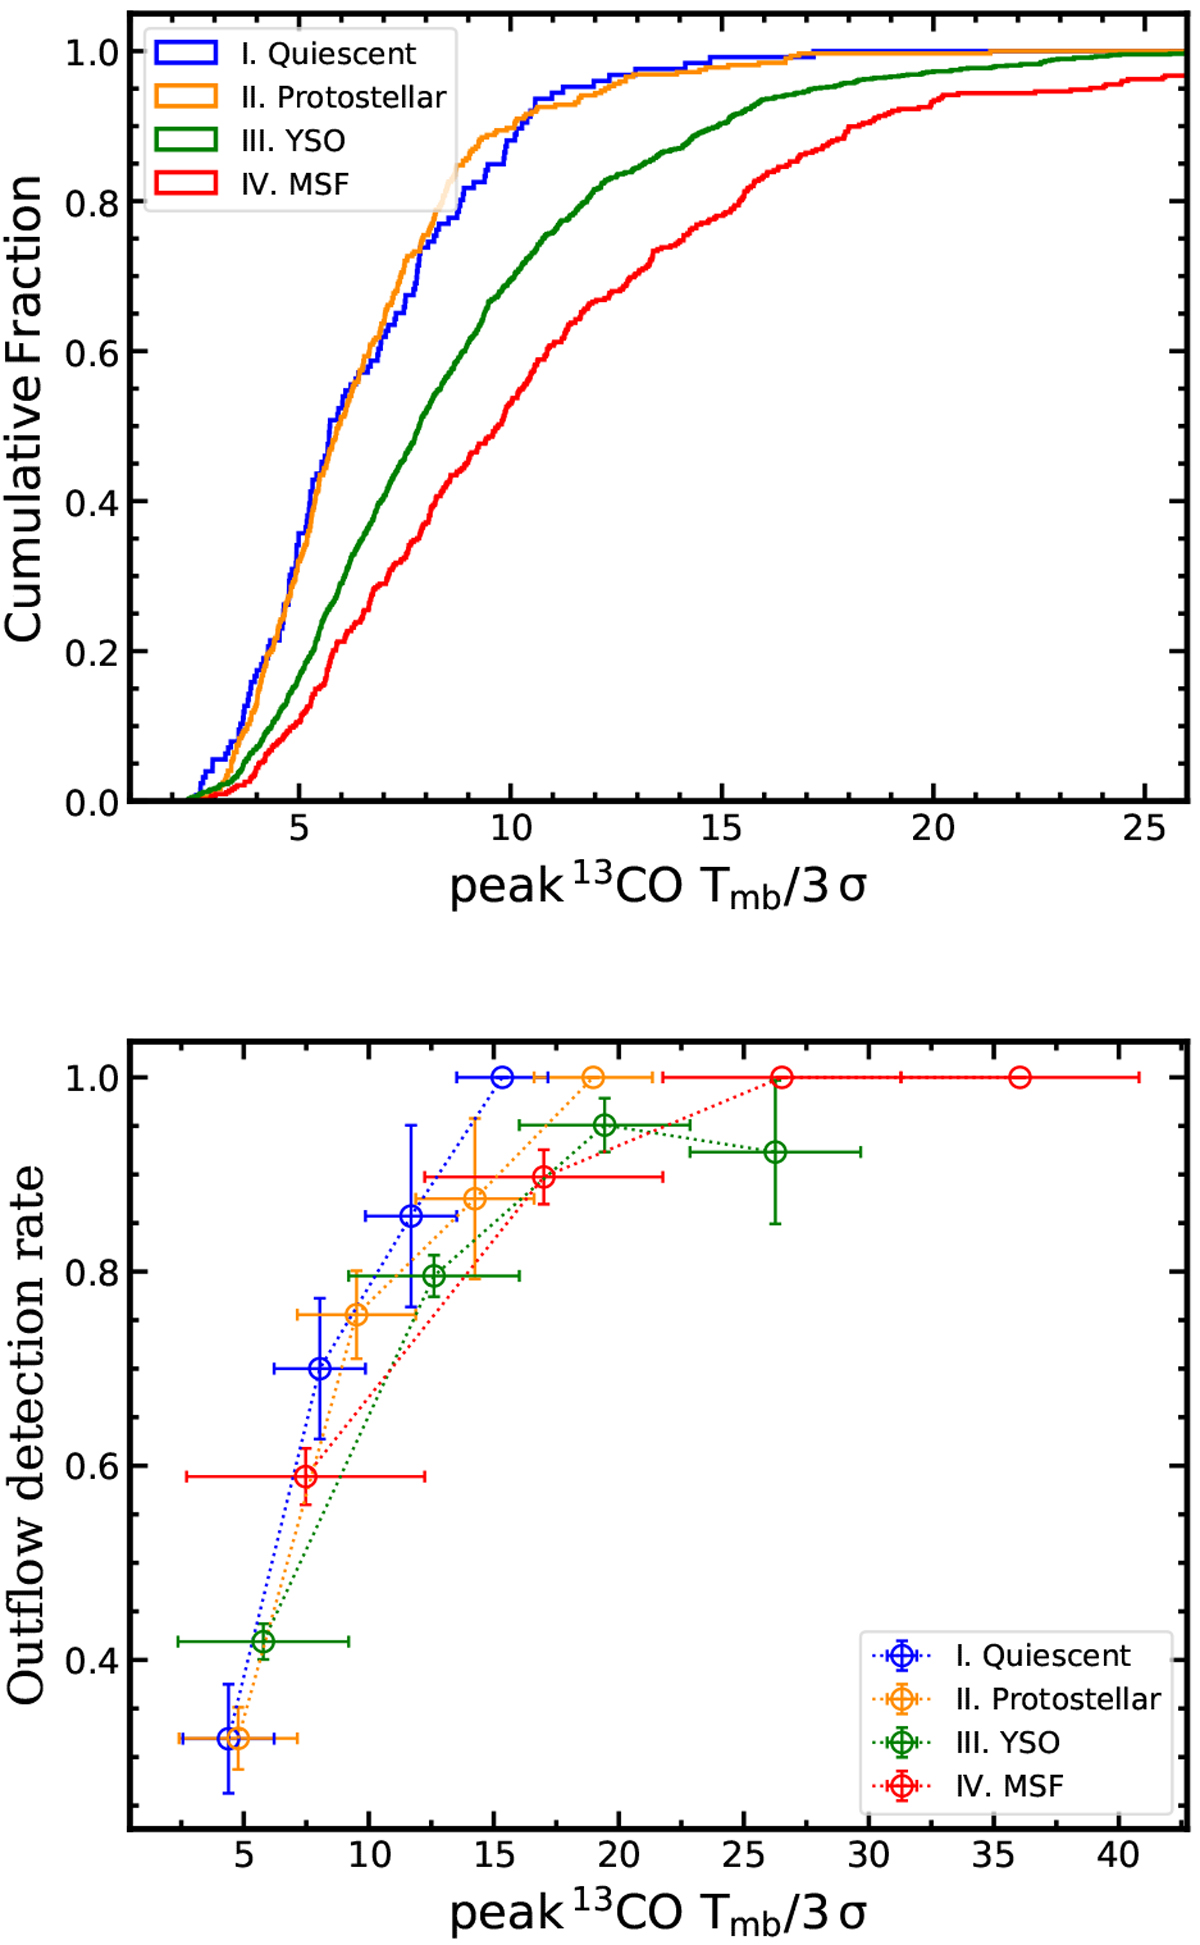
Fig. 10
Download original image
Distributions of the peak to 3σ ratio and its relation with outflow detection rate for clumps in different stages. Top panel: the cumulative distributions of the ratio between the peak of 13CO and 3σ noise level of each corresponding spectrum (peak 13CO (2–1) Tmb∕3σ) for clumps in the four evolutionary stages in the total 2052 sample. Bottom panel: outflow detection rate as a function of the (peak 13CO (2–1) Tmb∕3σ). This indicates that outflow wings are stronger for clumps in the late evolutionary stages and thus easier to detect, compared to clumps in the early evolutionary stages. The detection rates of outflows are likely to be similar for clumps in every evolutionary stage. The error bars on the x-axis and y-axis are determined following the same method in Fig. 6.
Current usage metrics show cumulative count of Article Views (full-text article views including HTML views, PDF and ePub downloads, according to the available data) and Abstracts Views on Vision4Press platform.
Data correspond to usage on the plateform after 2015. The current usage metrics is available 48-96 hours after online publication and is updated daily on week days.
Initial download of the metrics may take a while.