Fig. 9
Download original image
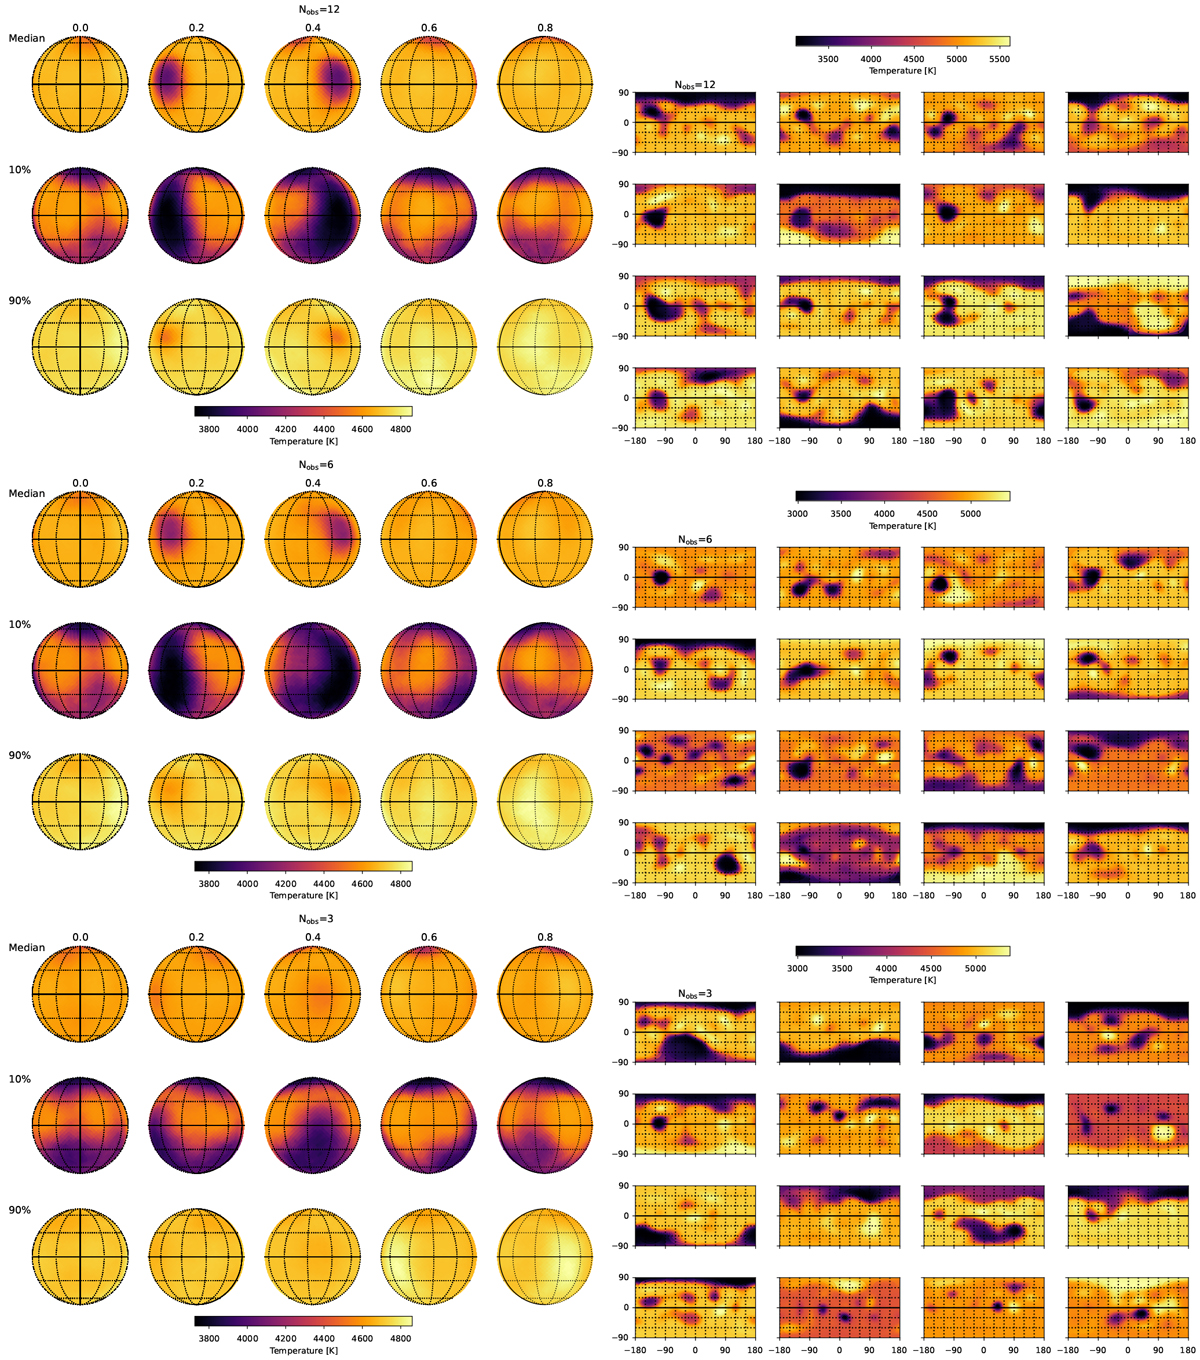
Bayesian inference for the surface of II Peg. Left panels: median and percentiles 10 and 90 of the posterior distribution for the temperature surface map. The star is shown from five points of view in order to obtain access to the inference in all points of the surface. Upper panel: results when all available observations are used. Middle panel: what happens when only half of the observations are used. Lower panel: results when only three observations are used. Right panels: 16 posterior samples for each case.
Current usage metrics show cumulative count of Article Views (full-text article views including HTML views, PDF and ePub downloads, according to the available data) and Abstracts Views on Vision4Press platform.
Data correspond to usage on the plateform after 2015. The current usage metrics is available 48-96 hours after online publication and is updated daily on week days.
Initial download of the metrics may take a while.