Fig. 5
Download original image
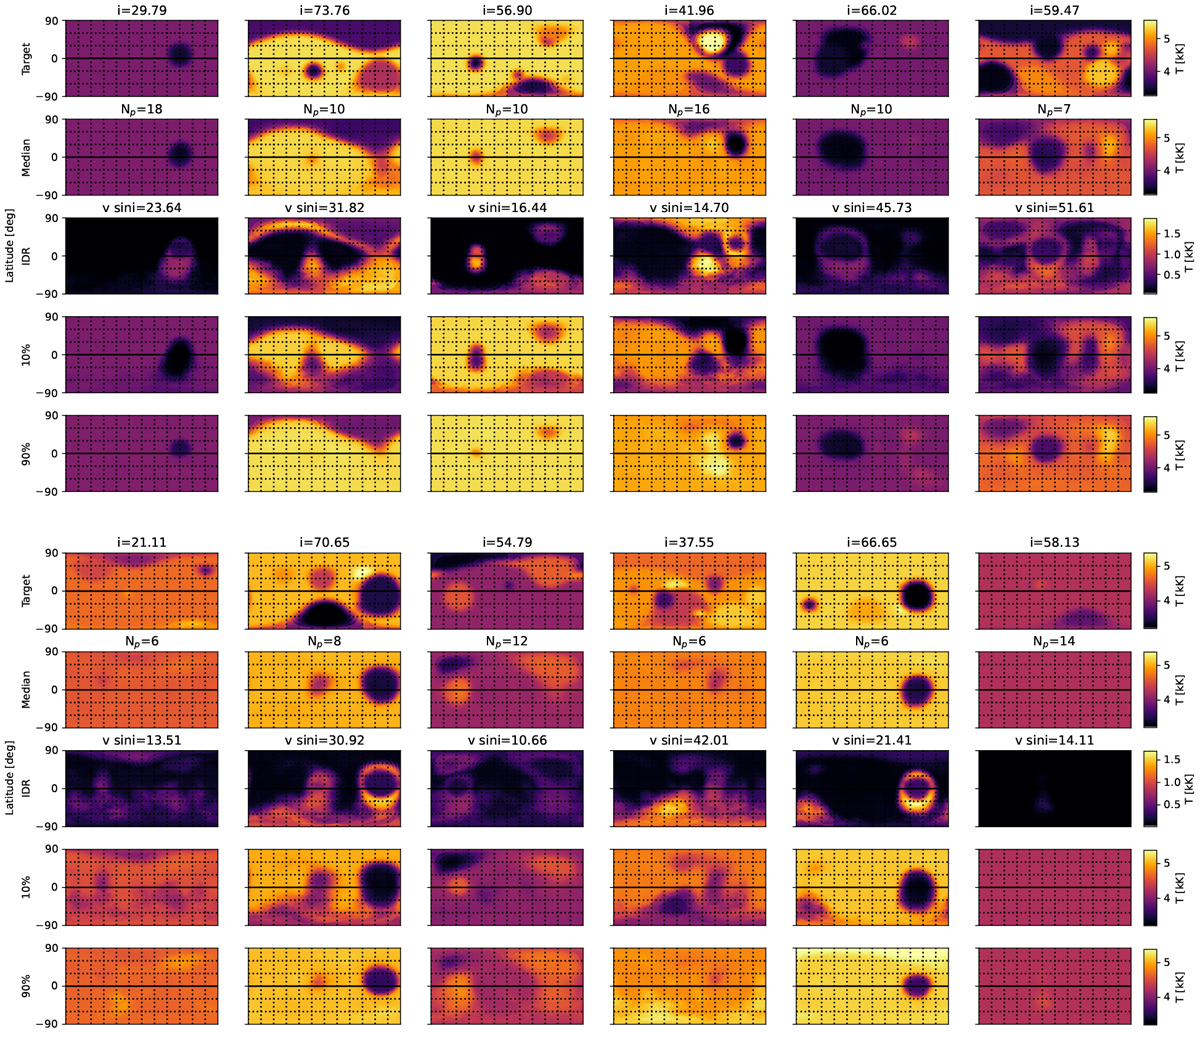
Results of the Bayesian inference for 12 (6 per panel) validation stars. The rotation velocity, number of phases, and v sin i of each star are indicated. The first row shows the target surface temperature map. The second and third rows show the median and the interdecile range. The last two rows display the percentiles 10 and 90. All units are given in kK.
Current usage metrics show cumulative count of Article Views (full-text article views including HTML views, PDF and ePub downloads, according to the available data) and Abstracts Views on Vision4Press platform.
Data correspond to usage on the plateform after 2015. The current usage metrics is available 48-96 hours after online publication and is updated daily on week days.
Initial download of the metrics may take a while.