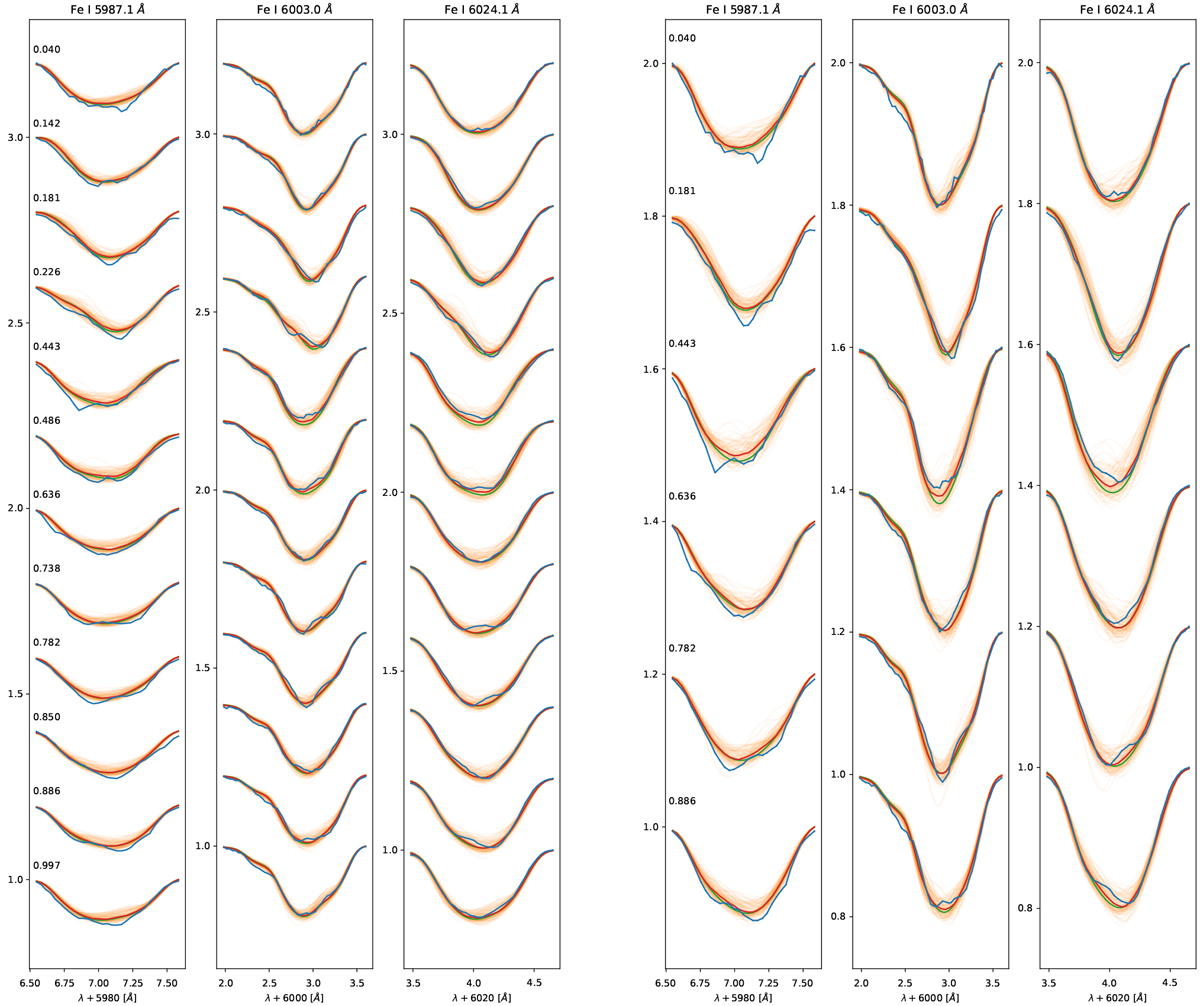
Fig. 10
Download original image
Spectra of II Peg at all phases. Orange lines: synthesis carried out with samples from the posterior. Blue lines: original observations. Green line: synthesis using the temperatures of the median estimation of the posterior. Red line: median of all spectral lines synthesized. Left panel: results for all phases, while right panel: results when half the observations are used. We show the three spectral regions used for the inference, marking the specific rotation phases with labels. The lines of each rotation phase are displaced by 0.2 units to avoid crowding.
Current usage metrics show cumulative count of Article Views (full-text article views including HTML views, PDF and ePub downloads, according to the available data) and Abstracts Views on Vision4Press platform.
Data correspond to usage on the plateform after 2015. The current usage metrics is available 48-96 hours after online publication and is updated daily on week days.
Initial download of the metrics may take a while.