Fig. 1
Download original image
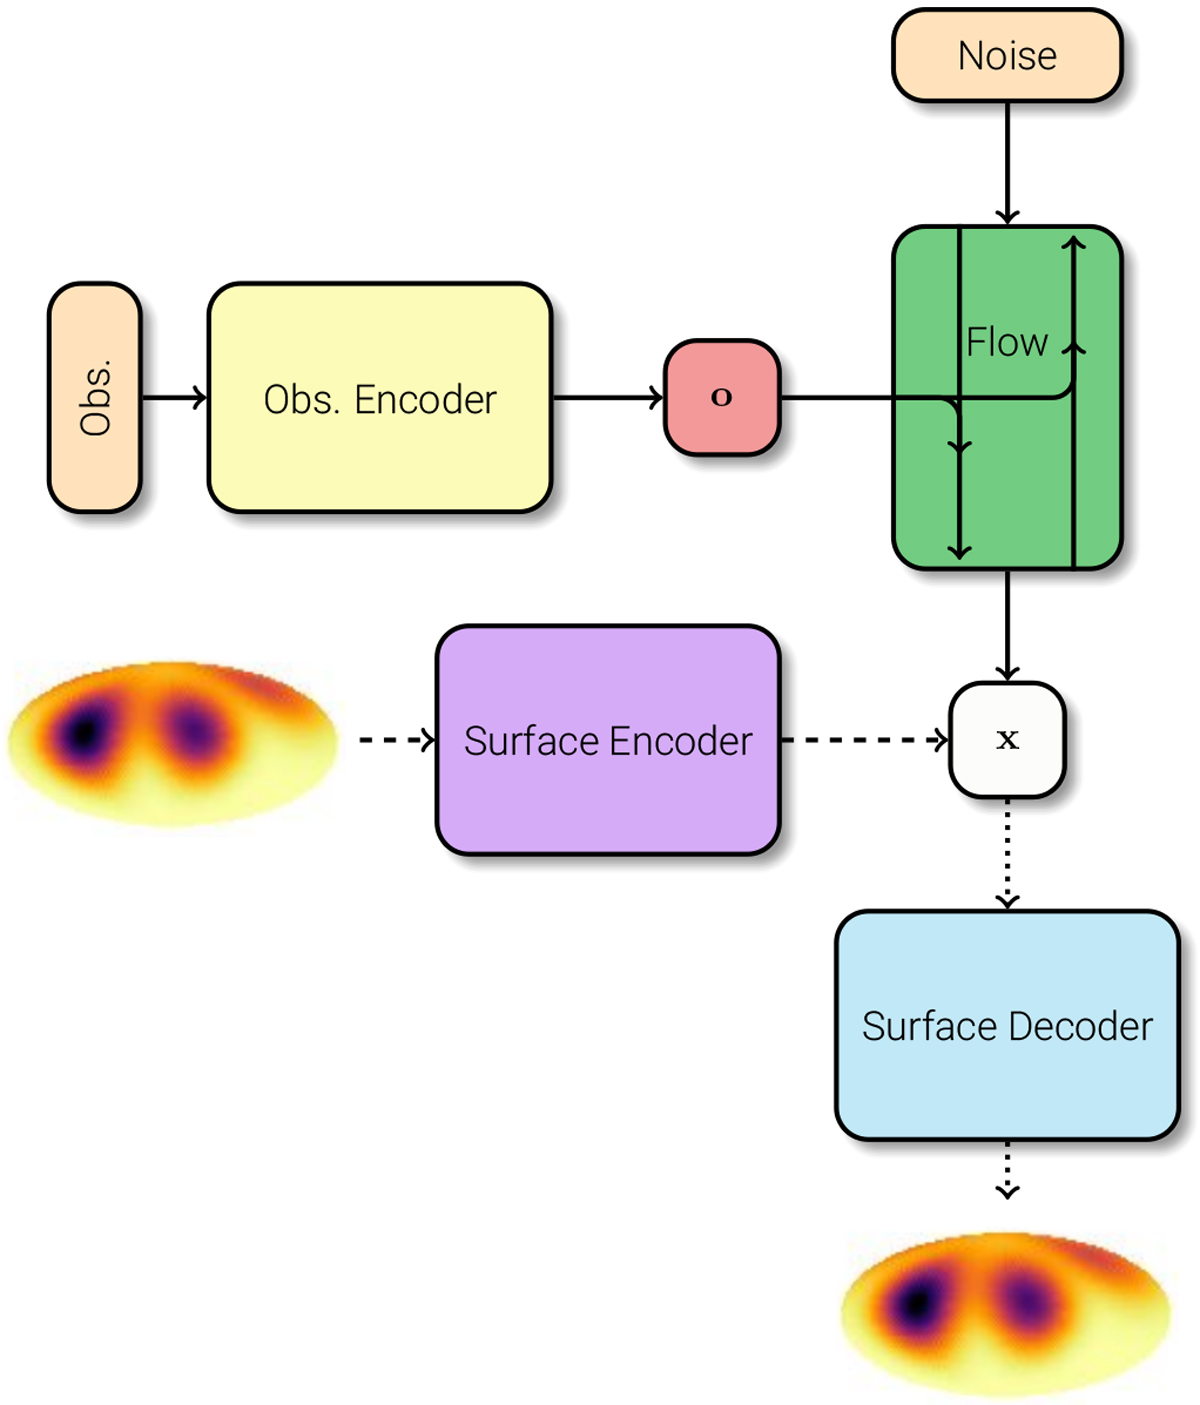
Schematic representation of the model. The blocks are described in detail in Sect. 4. Solid lines show connections between blocks that propagate gradients during training of the flow and observational encoder. Dashed lines in the autoencoder do not back-propagate gradients during training. Dotted lines are only used in validation to produce surface-temperature maps.
Current usage metrics show cumulative count of Article Views (full-text article views including HTML views, PDF and ePub downloads, according to the available data) and Abstracts Views on Vision4Press platform.
Data correspond to usage on the plateform after 2015. The current usage metrics is available 48-96 hours after online publication and is updated daily on week days.
Initial download of the metrics may take a while.