Fig. 8
Download original image
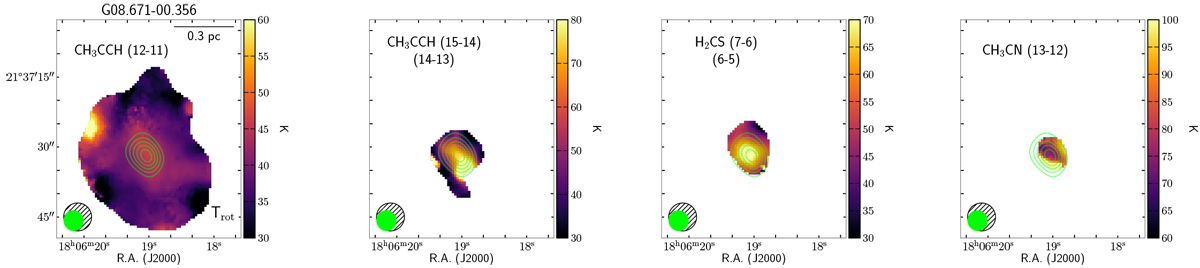
Rotational temperature maps of source G08b derived from multiple thermometer lines using the XCLASS package (Sect. 3.4). The green contours indicate SMA 1.2 mm continuum levels from 0.3 to 0.9 × peak flux (Table 4) in five steps of uniform interval. The beams of the continuum and the respective lines are shown in the lower left corner as green and hatched ellipses, respectively.
Current usage metrics show cumulative count of Article Views (full-text article views including HTML views, PDF and ePub downloads, according to the available data) and Abstracts Views on Vision4Press platform.
Data correspond to usage on the plateform after 2015. The current usage metrics is available 48-96 hours after online publication and is updated daily on week days.
Initial download of the metrics may take a while.