Fig. 7
Download original image
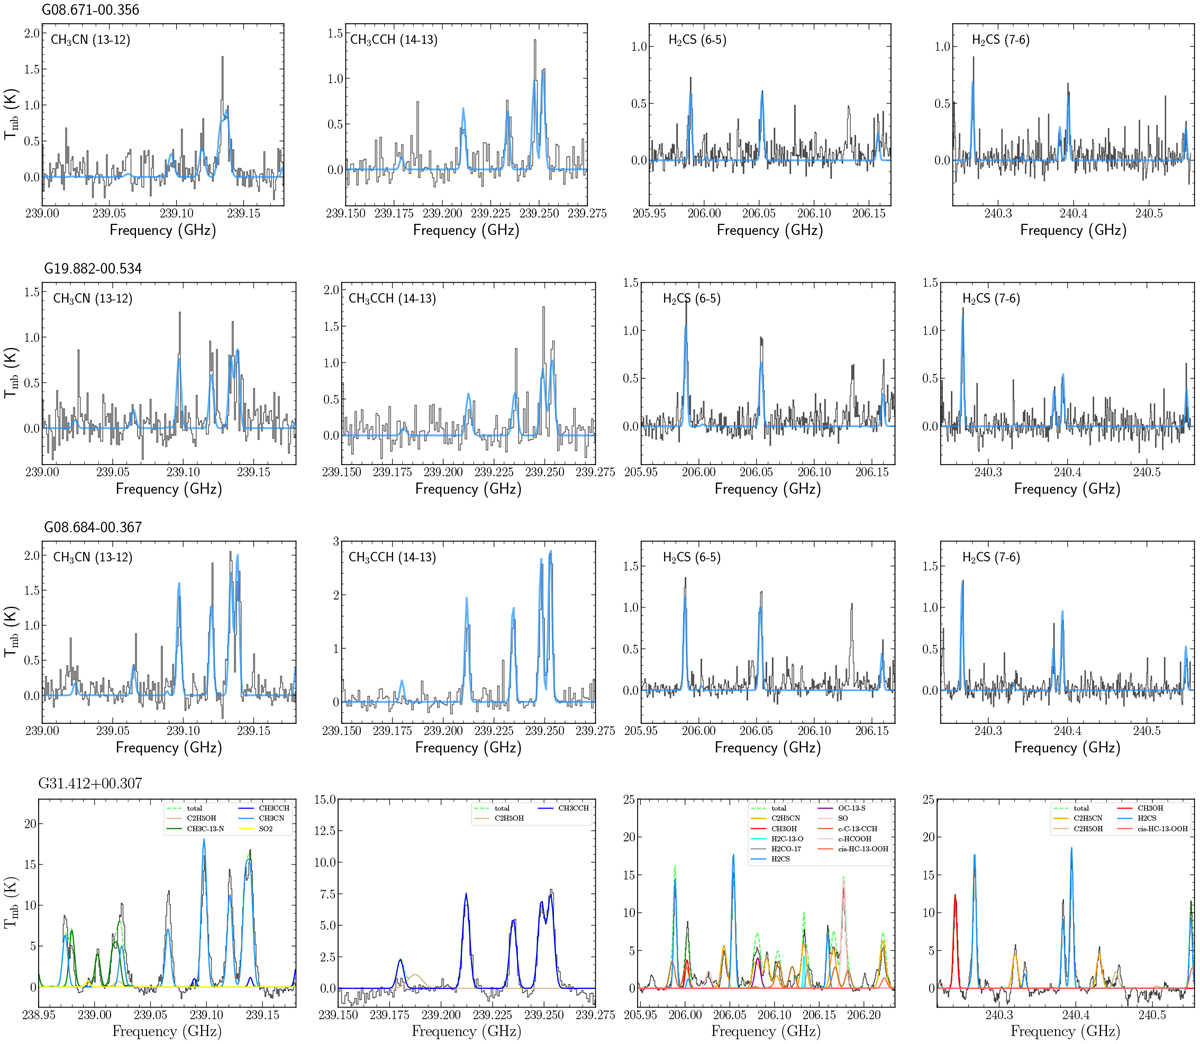
Example spectra of thermometer lines CH3CN J = 13-12, CH3CCH J = 14-13, H2CS J = 6-5, H2CS J = 7-6 at the continuum peak of the target source. The blue profiles show the XCLASS LTE fitting results. For source G31.412+0.307, which presents significant line blending from other species, the fittings also included those species and transitions that can potentially make prominent contributions to the spectrum.
Current usage metrics show cumulative count of Article Views (full-text article views including HTML views, PDF and ePub downloads, according to the available data) and Abstracts Views on Vision4Press platform.
Data correspond to usage on the plateform after 2015. The current usage metrics is available 48-96 hours after online publication and is updated daily on week days.
Initial download of the metrics may take a while.