Fig. 5
Download original image
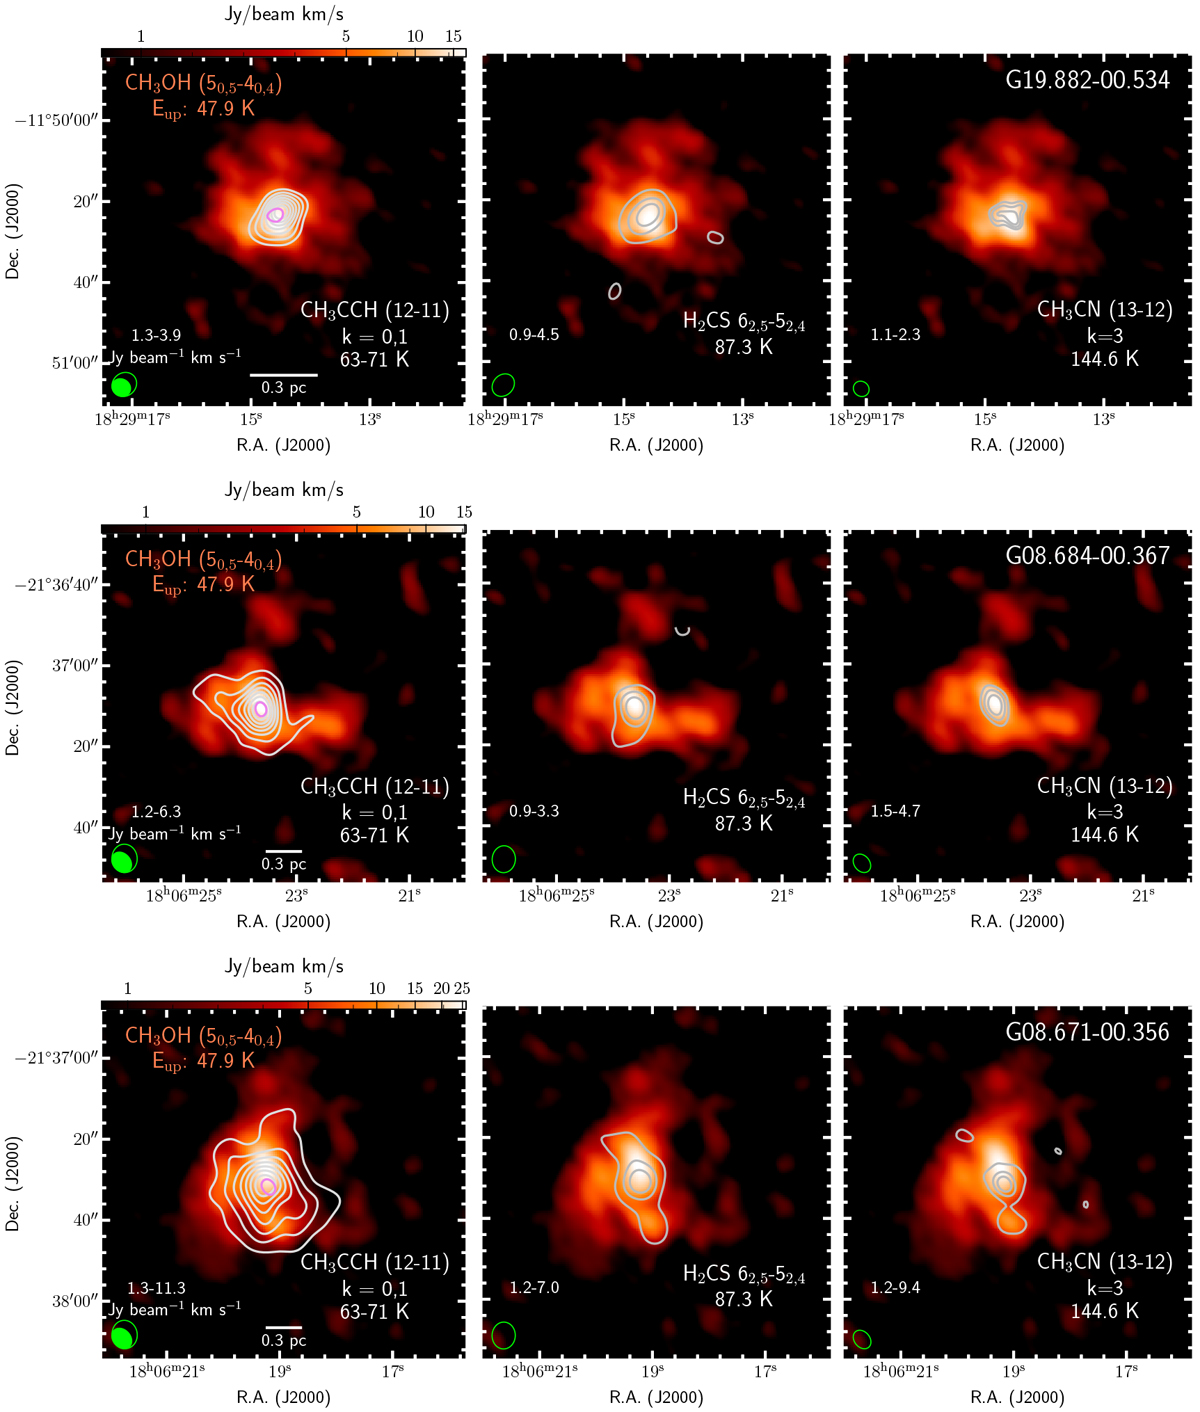
Integrated intensity maps (gray contours) of CH3CCH, H2CS, and CH3CN toward sources G19, G08a, and G08b. Integrated intensity of CH3OH 50,5 –40,4 ([vlsr −3, vlsr + 3] km s−1) is shown in color scale. Gray contours show the intensity levels with uniform intervals from 5σ up to the peak flux, with the emission range (Jy beam−1 km s−1) indicated in the lower left corner of each panel. Colored contour in the left panel shows the location of 0.8 × peak emission of the 1.2 mm SMA continuum image. The green ellipses indicate beams of corresponding molecular lines (open) and CH3OH 50,5 –40,4 line (filled).
Current usage metrics show cumulative count of Article Views (full-text article views including HTML views, PDF and ePub downloads, according to the available data) and Abstracts Views on Vision4Press platform.
Data correspond to usage on the plateform after 2015. The current usage metrics is available 48-96 hours after online publication and is updated daily on week days.
Initial download of the metrics may take a while.