Fig. 4
Download original image
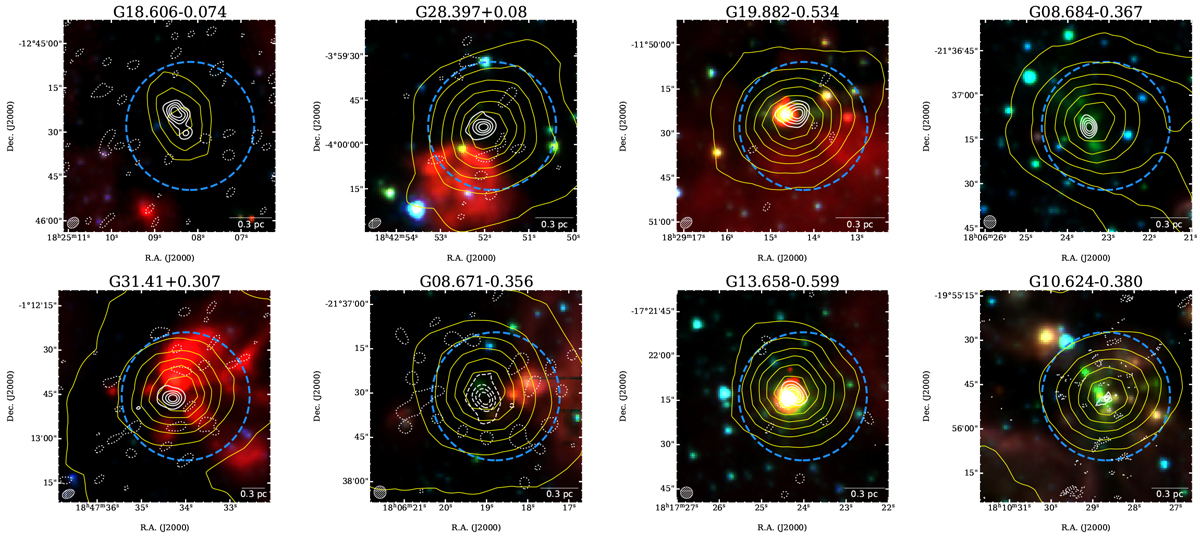
Spitzer IRAC RGBs (R: 8.0 μm; G: 4.5 μm B: 3.6 μm) maps of the target sources. Yellow contours show the ATLASGAL 870 μm emission from 1 Jy beam−1 to the peak flux for each source, using seven levels with uniform spacing. White contours show SMA 1.2 mm emission from 3σ to the peak flux using five levels with uniform spacing. Negative flux levels of the 1.2 mm continuum are shown in contours of dotted lines, from − 1σ to the minimum negative flux with two levels. The beam of the SMA continuum is shown in the lower left corner of each plot. The beam size of the archival data for source G10 is much smaller than other sources (Sect. 2.2). The primary beam size is shown in each plot as a blue dashed circle.
Current usage metrics show cumulative count of Article Views (full-text article views including HTML views, PDF and ePub downloads, according to the available data) and Abstracts Views on Vision4Press platform.
Data correspond to usage on the plateform after 2015. The current usage metrics is available 48-96 hours after online publication and is updated daily on week days.
Initial download of the metrics may take a while.