Fig. F.2
Download original image
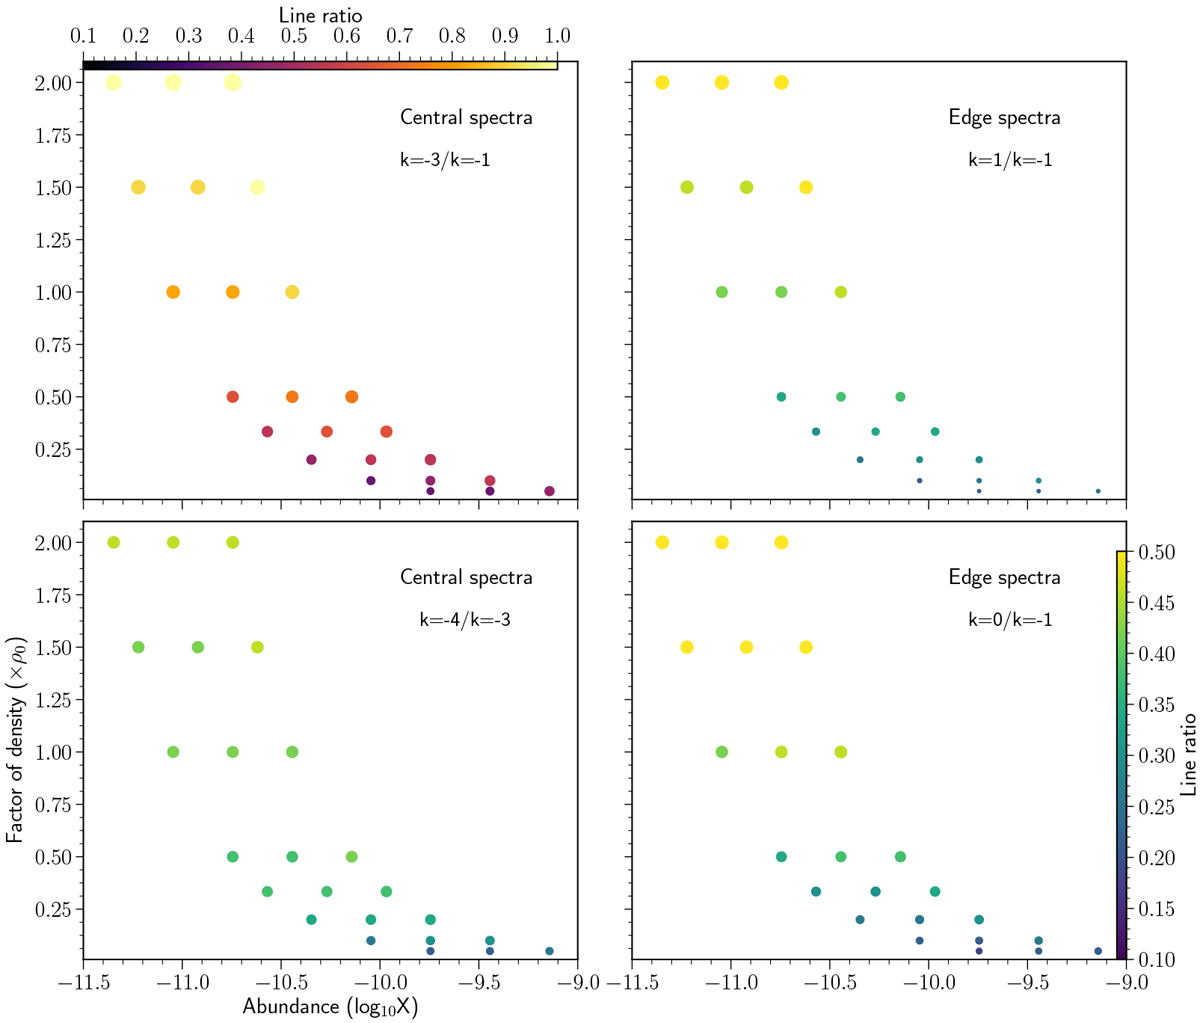
Line ratios of CH3OH (5-4) K components from LIME models based on density profile of G08b (ρ0 corresponds to the adjusted reference density at 0.1 pc for this source, as in Equation 6). The abundance value corresponds to the outer abundance (Xout), as in Table 7. The central symbol at the horizontal line of y = 1 corresponds to the best-fit model listed in Table. 7 (column B). The comparison of observations with model spectra is presented in Figure 14, top panel.
Current usage metrics show cumulative count of Article Views (full-text article views including HTML views, PDF and ePub downloads, according to the available data) and Abstracts Views on Vision4Press platform.
Data correspond to usage on the plateform after 2015. The current usage metrics is available 48-96 hours after online publication and is updated daily on week days.
Initial download of the metrics may take a while.