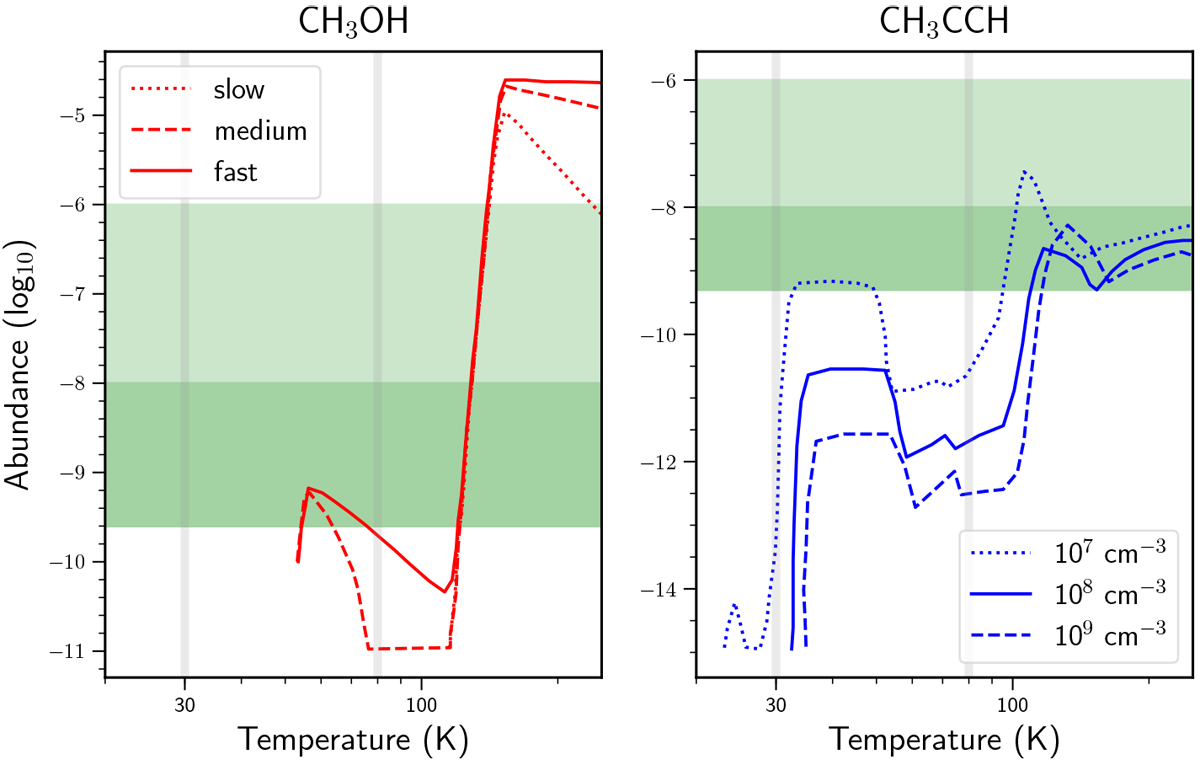
Fig. F.1
Download original image
Abundance variations of CH3OH and CH3CCH from chemical models (lines) and the explored parameter space (filled) for the LIME models based on ρbulk density model (column A of Table 7). The results from the chemical models are shown as lines (solid, dashed, and dotted): for CH3OH the abundance profiles for different warm-up timescales are shown (Garrod et al. 2017); for CH3CCH, abundance profiles of different final collapse densities are shown (Calcutt et al. 2019). The dark green filled region indicates the lower abundance range explored for Xout by the LIME models, and the light green filled region the upper range explored for Xin. The verticalgray lines indicate the jump in temperature of 30 and 80 K.
Current usage metrics show cumulative count of Article Views (full-text article views including HTML views, PDF and ePub downloads, according to the available data) and Abstracts Views on Vision4Press platform.
Data correspond to usage on the plateform after 2015. The current usage metrics is available 48-96 hours after online publication and is updated daily on week days.
Initial download of the metrics may take a while.