Fig. E.1
Download original image
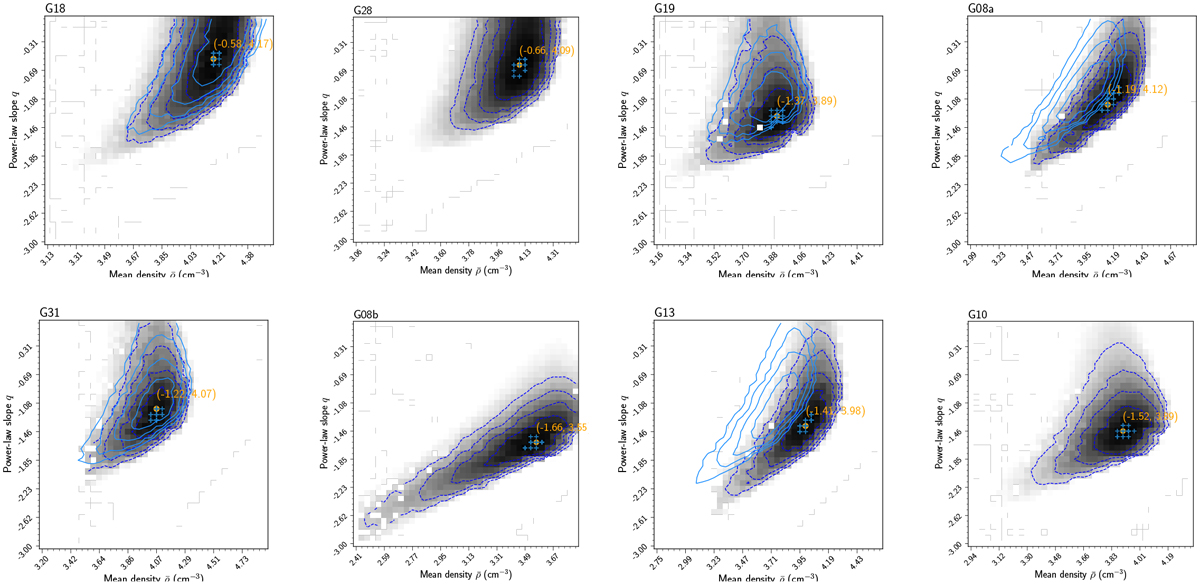
χ2 converted probability distribution of the 10 000 parameter set of RADMC-3D models for all clumps. The orange point indicates the best-fit model. Blue crosses give the positions of the 30 best-fit models, so there could be overlaps between the different parameter sets due to the binning. For sources G31, G13, G08a, and G19 the results before re-adjusting T(r) based on SED are shown as light blue contours.
Current usage metrics show cumulative count of Article Views (full-text article views including HTML views, PDF and ePub downloads, according to the available data) and Abstracts Views on Vision4Press platform.
Data correspond to usage on the plateform after 2015. The current usage metrics is available 48-96 hours after online publication and is updated daily on week days.
Initial download of the metrics may take a while.