Open Access
Fig. C.2
Download original image
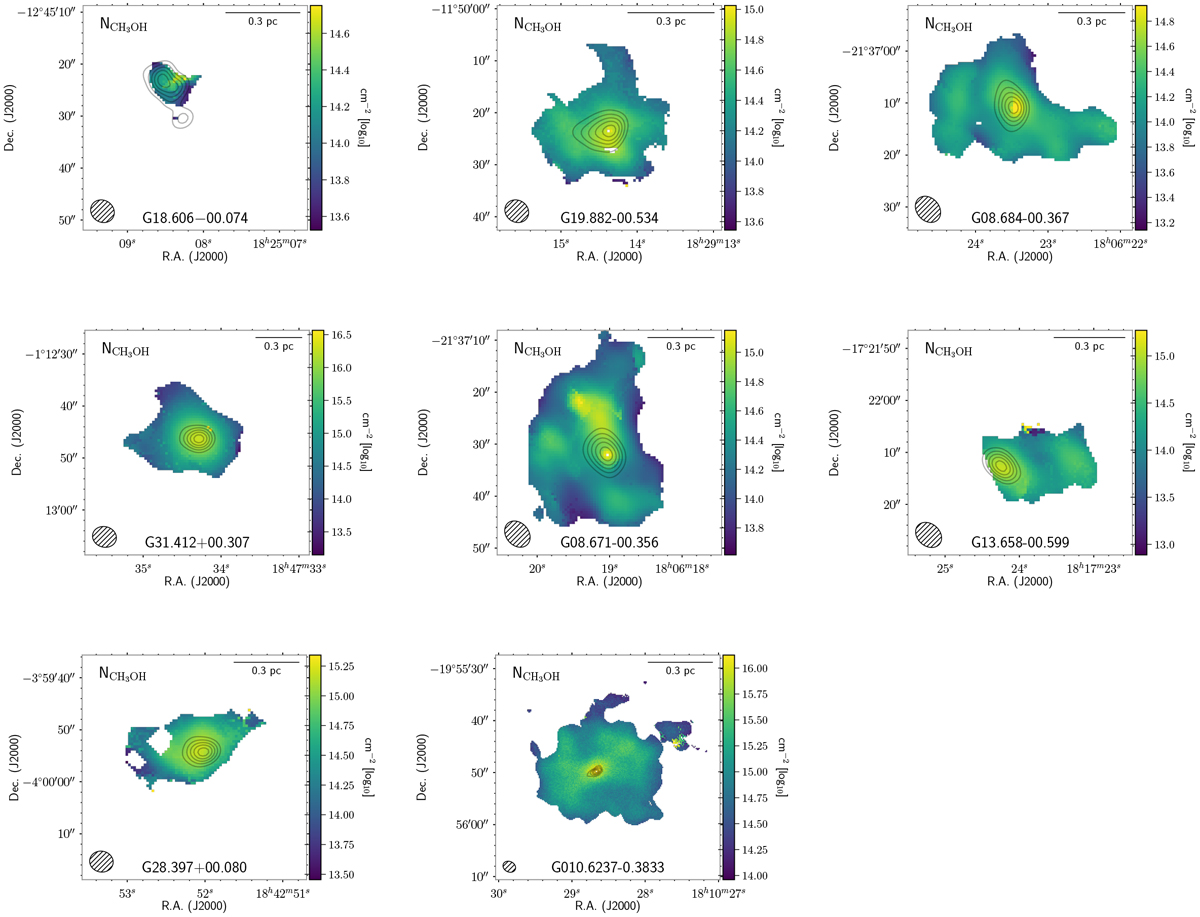
CH3OH column density maps (![]() ) derived fromRADEX modeling of all target sources. The beam of CH3OH 5−1 -4−1
E
line is indicated in the bottom left corner. Gray contours indicate the SMA 1.2 mm continuum level from 0.1 to 0.9 × peak flux in five steps of uniform interval.
) derived fromRADEX modeling of all target sources. The beam of CH3OH 5−1 -4−1
E
line is indicated in the bottom left corner. Gray contours indicate the SMA 1.2 mm continuum level from 0.1 to 0.9 × peak flux in five steps of uniform interval.
Current usage metrics show cumulative count of Article Views (full-text article views including HTML views, PDF and ePub downloads, according to the available data) and Abstracts Views on Vision4Press platform.
Data correspond to usage on the plateform after 2015. The current usage metrics is available 48-96 hours after online publication and is updated daily on week days.
Initial download of the metrics may take a while.