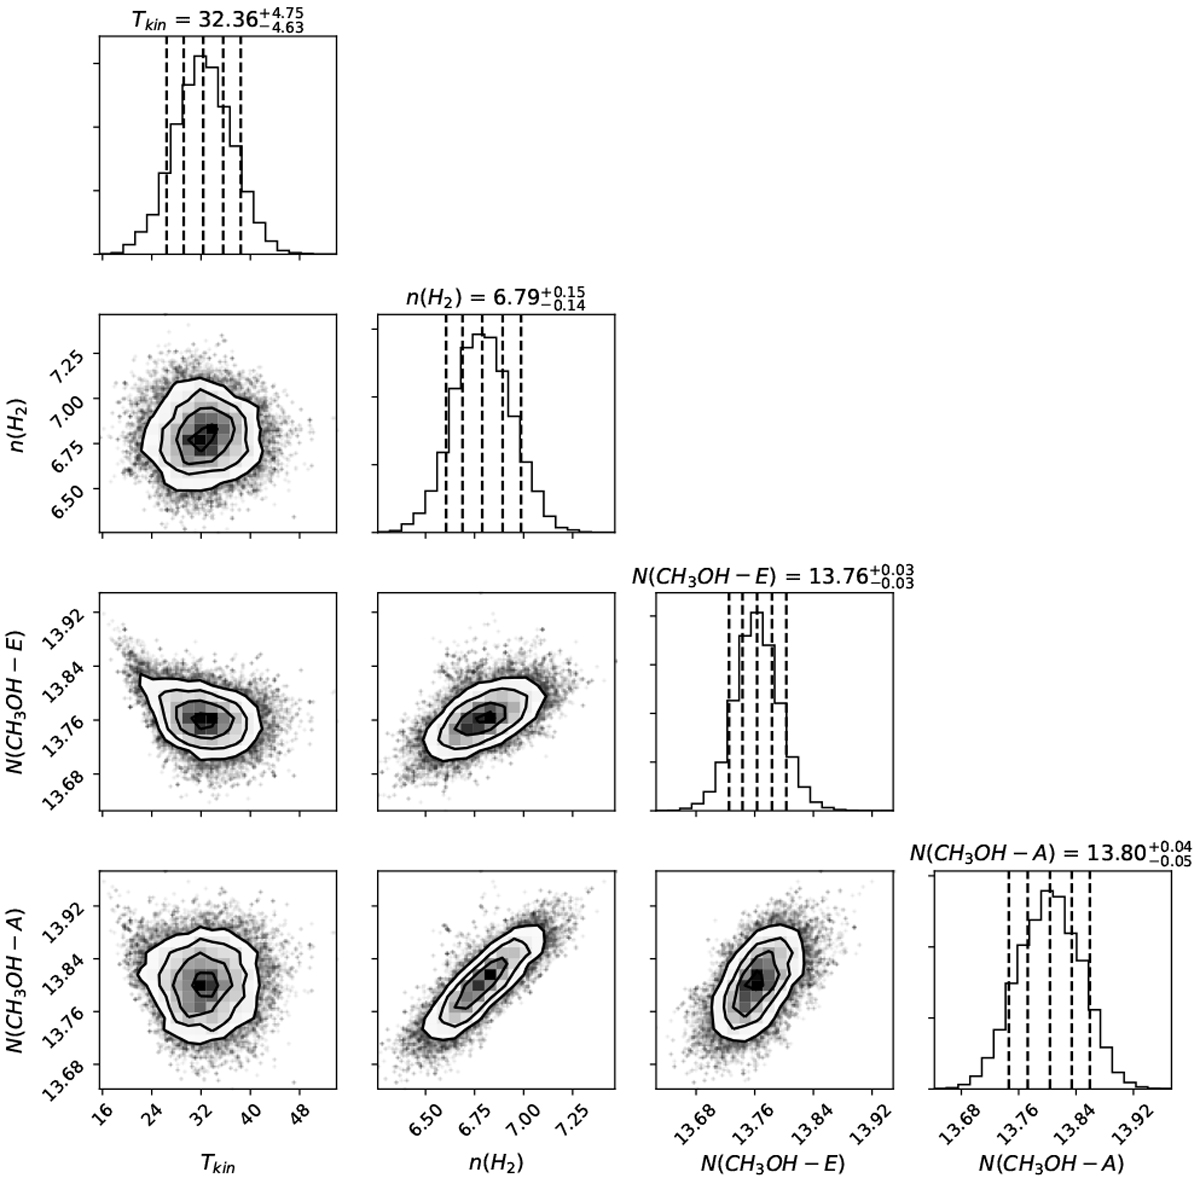
Fig. C.1
Download original image
Posterior distribution of parameters from MCMC RADEX fitting of CH3OH (5-4) line series. The column densities of A∕E type are velocity averaged values (log cm−2/km s−1). The vertical dashed lines in the 1D histograms show the quantiles of 10%, 25%, 50%, 75%, and 90%. The contour levels in the 2D histograms indicate 0.5σ, 1σ, 1.5σ, and 2σ. The figure shows an example of the fitted parameters of observed lines in one pixel of clump G08b.
Current usage metrics show cumulative count of Article Views (full-text article views including HTML views, PDF and ePub downloads, according to the available data) and Abstracts Views on Vision4Press platform.
Data correspond to usage on the plateform after 2015. The current usage metrics is available 48-96 hours after online publication and is updated daily on week days.
Initial download of the metrics may take a while.