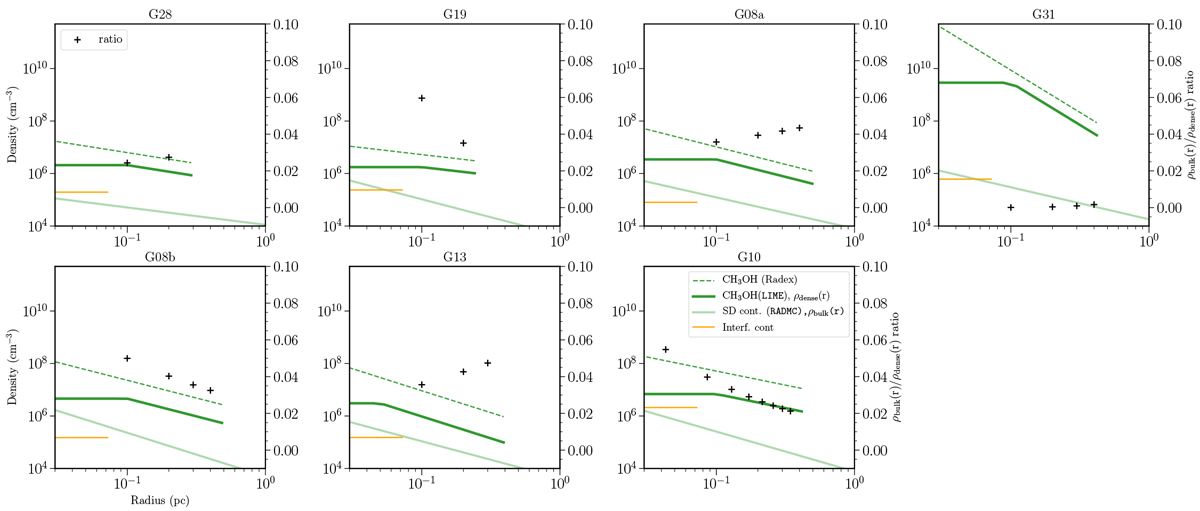
Fig. 22
Download original image
Comparison between gas density profiles derived by modeling continuum and CH3OH line emission. The ratio of densities derived by CH3OH LIME modeling (ρdense) to continuum results (ρbulk) are shown aspluses (following right y-axis). The density estimated by SMA 1.2 mm continuum observations representing the central core average density is shown as a verticalorange line in each plot (Table 4).
Current usage metrics show cumulative count of Article Views (full-text article views including HTML views, PDF and ePub downloads, according to the available data) and Abstracts Views on Vision4Press platform.
Data correspond to usage on the plateform after 2015. The current usage metrics is available 48-96 hours after online publication and is updated daily on week days.
Initial download of the metrics may take a while.