Fig. 21
Download original image
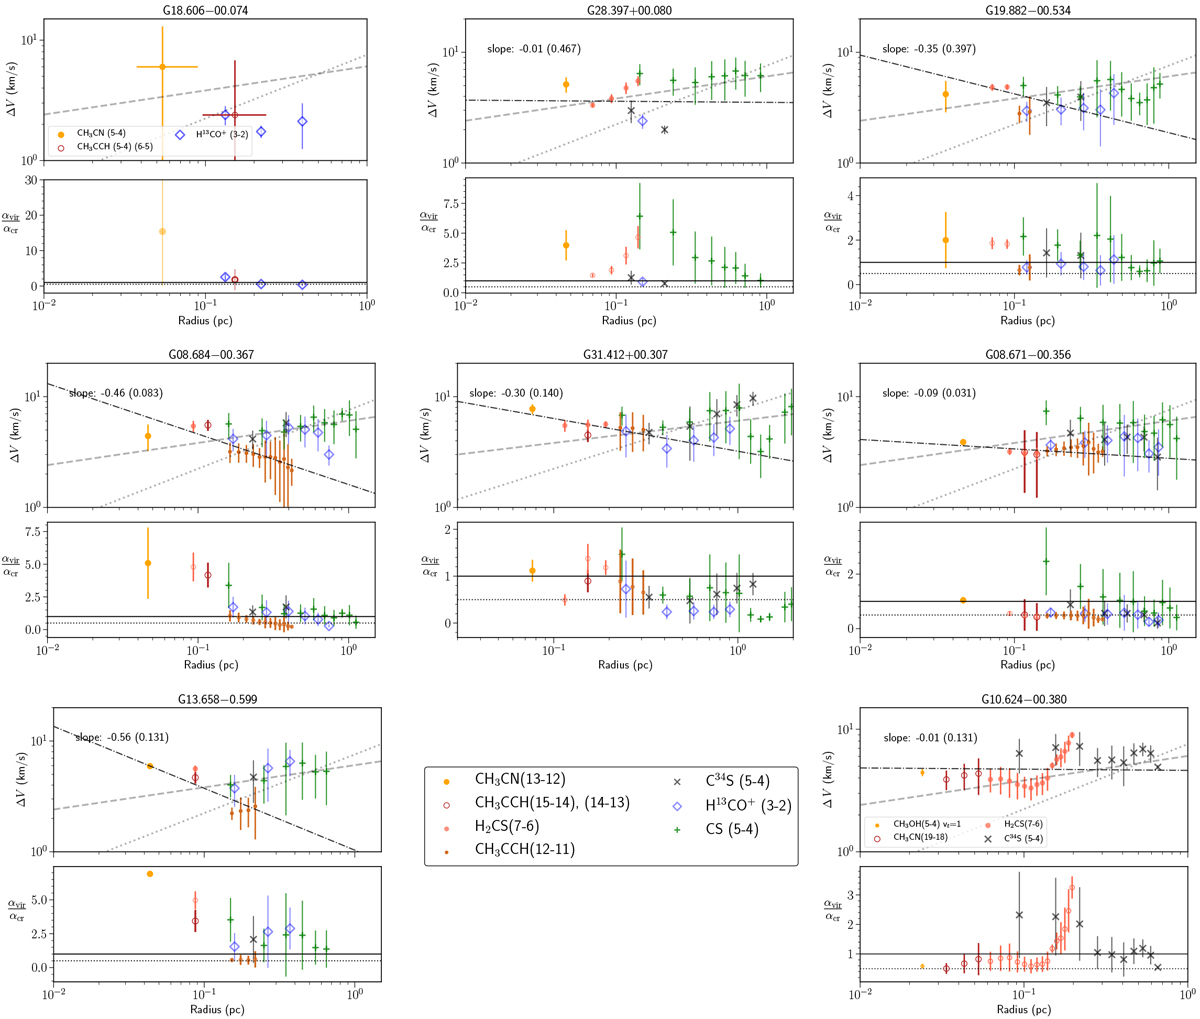
Derived averaged radial linewidth and virial parameter profiles. The dash-dotted line in each upper panel indicates the power-law fit to the linewidths from the thermometer lines. In each upper panel the gray dotted line indicates the relation found by Caselli & Myers (1995) of Orion low-mass cores scaled up by a factor of 5, which roughly matches the observed linewidth in our case, of
![]() . The gray dashed line shows a relation of Δv∕1 km s−1 = 6.0 (r∕1 pc)0.2. These two reference lines are identical in all plots. In each lower panel, the ratio of
αvir to the critical virial parameter αcr
is shown; the horizontal solid and dotted line indicate a ratio of 1 (equipartition) and 0.5 (virial equilibrium), respectively. All plots except for G10 and G18 share the same legend shown in the middle panel of the last row, where the color-coding for the thermometer lines is the same as in Fig. 20.
. The gray dashed line shows a relation of Δv∕1 km s−1 = 6.0 (r∕1 pc)0.2. These two reference lines are identical in all plots. In each lower panel, the ratio of
αvir to the critical virial parameter αcr
is shown; the horizontal solid and dotted line indicate a ratio of 1 (equipartition) and 0.5 (virial equilibrium), respectively. All plots except for G10 and G18 share the same legend shown in the middle panel of the last row, where the color-coding for the thermometer lines is the same as in Fig. 20.
Current usage metrics show cumulative count of Article Views (full-text article views including HTML views, PDF and ePub downloads, according to the available data) and Abstracts Views on Vision4Press platform.
Data correspond to usage on the plateform after 2015. The current usage metrics is available 48-96 hours after online publication and is updated daily on week days.
Initial download of the metrics may take a while.