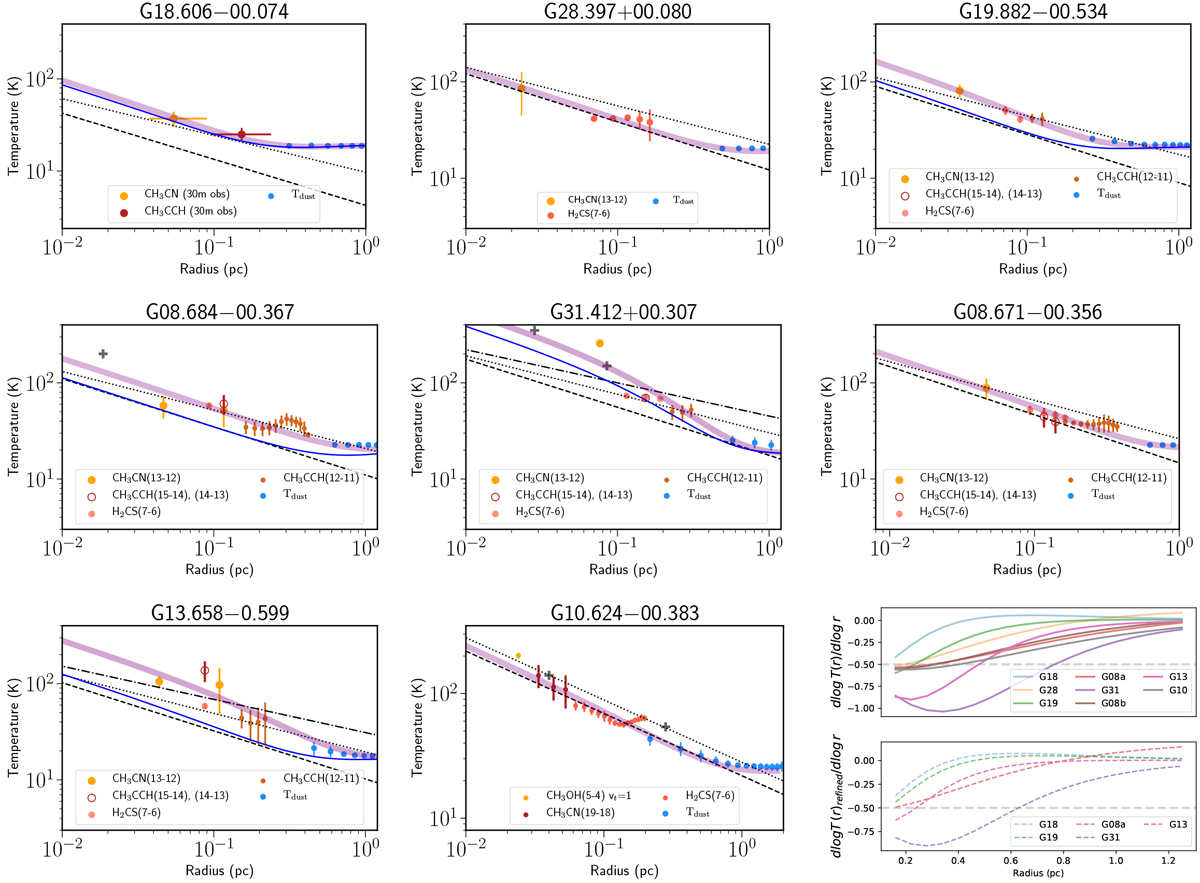
Fig. 20
Download original image
Derived radial averaged temperature profiles of the target sources from multiple thermometers. The error bars show the standard deviations for each annular average. The dashed and dotted lines show a radial temperature profile that follows ∝ L0.25r−0.5 (β = 0) and L0.2r−0.4 (β = 1), respectively (for details, see Sect. 3.6). For G13 and G31 an additional radial temperature profile of ∝ L0.17r−0.34 (β = 1.8, Adams 1991) is shown (dash-dotted line). Whenever available, temperature measurements from higher angular resolution observations from previous works are included in the plots as gray crosses. The thick purple line indicates the fitted temperature profile T(r) described in Sect. 3.6. The blue thin line indicates the refined temperature profile by varying rin in T(r) (Eq. (3)) to fit with dust SED (refined T(r), Appendix E). The plots in the bottom right panel show the first derivative d log T/d logR (for all sources, top) calculated from the fitted profile T(r), and the refined T(r) (for five sources, bottom).
Current usage metrics show cumulative count of Article Views (full-text article views including HTML views, PDF and ePub downloads, according to the available data) and Abstracts Views on Vision4Press platform.
Data correspond to usage on the plateform after 2015. The current usage metrics is available 48-96 hours after online publication and is updated daily on week days.
Initial download of the metrics may take a while.