Fig. 2
Download original image
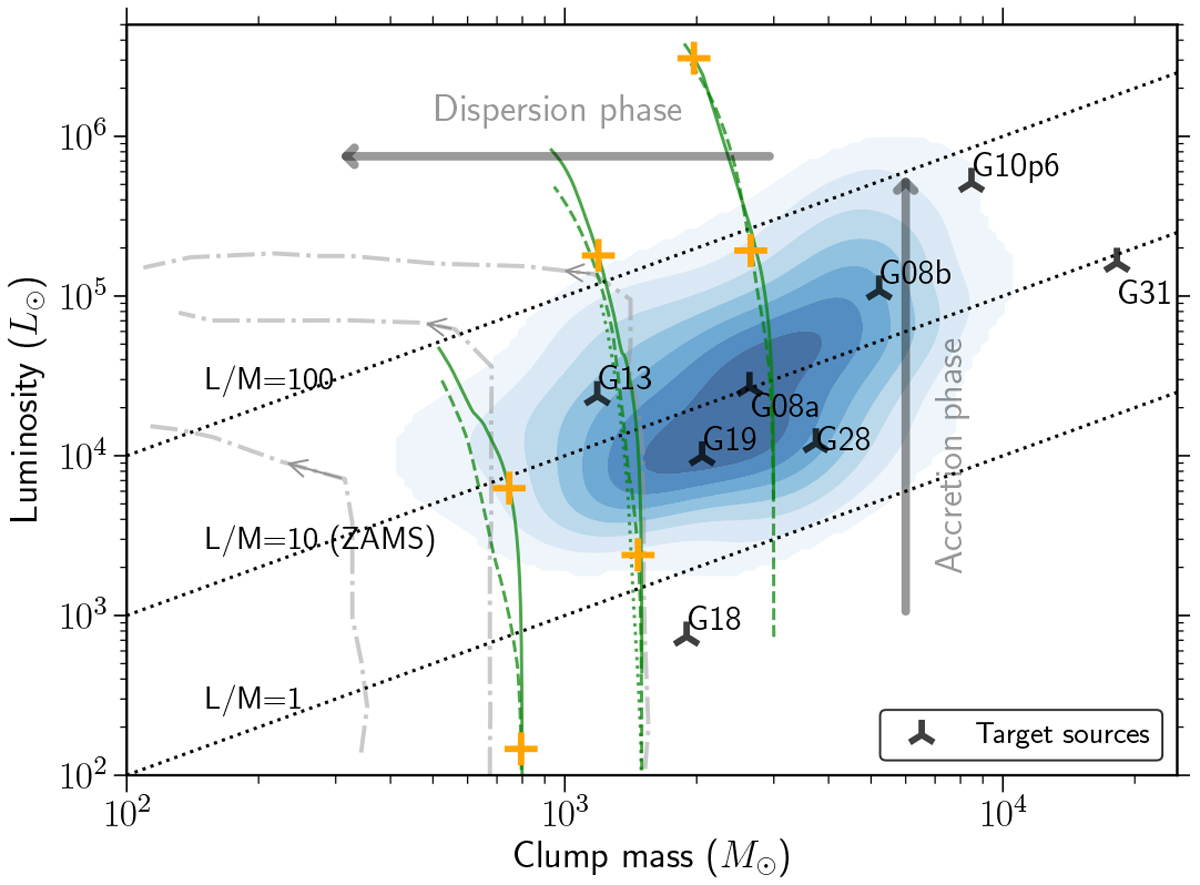
Luminosity–mass diagram of target sources (three-branched triangles). The evolutionary tracks of massive clumps of different envelope masses that form a cluster of stars with different accretion rates are shown as dotted and solid green lines; the evolutionary tracks of clumps of different envelope masses that are assumed to form a single massive star are shown as dash-dotted gray lines with arrows (Molinari et al. 2008; for more details see Sect. 2.1).
Current usage metrics show cumulative count of Article Views (full-text article views including HTML views, PDF and ePub downloads, according to the available data) and Abstracts Views on Vision4Press platform.
Data correspond to usage on the plateform after 2015. The current usage metrics is available 48-96 hours after online publication and is updated daily on week days.
Initial download of the metrics may take a while.