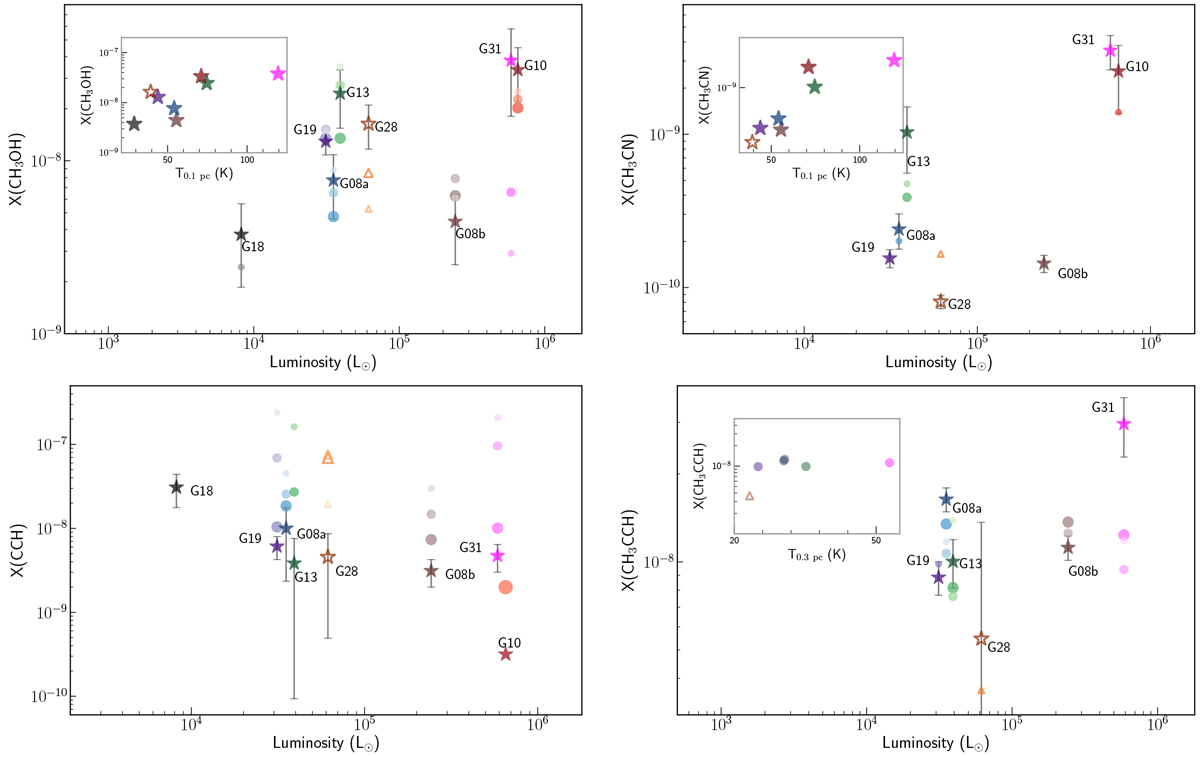
Fig. 17
Download original image
Abundance profiles of molecules CH3OH, CH3CN, CCH, and CH3CCH toward target sources. The symbols are color-coded based on relative distance to the clump center (the 1.2 mm continuum peak). Stars represent abundances at the clump center, and hollow circles or triangles indicate abundances obtained from different radii: the larger and darker these symbols, the closer the distance to the continuum peak. For clump G28 the data points at outer radii are shown as triangles, whereas those for other clumps are shown as circles, to further avoid confusion. X(CCH) for source G10 is taken from Jiang et al. (2015). The inset plot for CH3CN shows the central abundance vs. gas temperature at 0.1 pc; the plot for CH3CCH shows the envelope abundance vs. gas temperature at 0.3 pc.
Current usage metrics show cumulative count of Article Views (full-text article views including HTML views, PDF and ePub downloads, according to the available data) and Abstracts Views on Vision4Press platform.
Data correspond to usage on the plateform after 2015. The current usage metrics is available 48-96 hours after online publication and is updated daily on week days.
Initial download of the metrics may take a while.