Fig. 16
Download original image
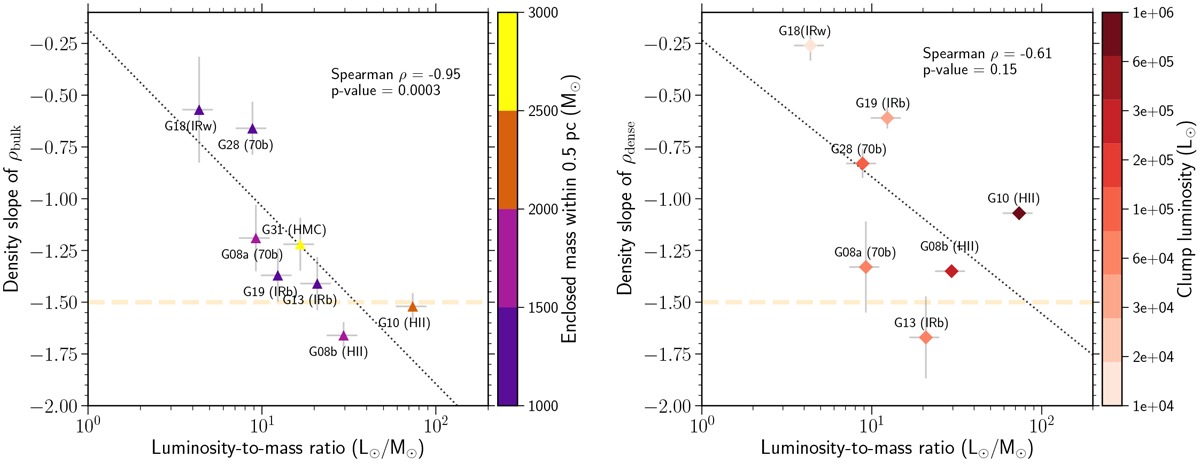
Radial gas density slopes of all target clumps. Left panel: density power-law slope derived from continuum (q) based on RADMC-3D modeling detailed in Appendix E. The luminosity, clump mass, and enclosed mass within 0.5 pc are calculated from the RADMC-3D best-fit model, as listed in Table 6. Right panel: density power-law slope derived from n(H2) maps (qradex) from the CH3OH RADEX modeling detailed in Sect. 3.5. The yellow horizontal line in both plots shows a slope of –1.5, indicating the free-falling density profile of a singular isothermal sphere (with an initial density slope of –2) as in Shu 1977, and the attractor solution of the gravo-turbulent collapsing in Murray et al. (2017).
Current usage metrics show cumulative count of Article Views (full-text article views including HTML views, PDF and ePub downloads, according to the available data) and Abstracts Views on Vision4Press platform.
Data correspond to usage on the plateform after 2015. The current usage metrics is available 48-96 hours after online publication and is updated daily on week days.
Initial download of the metrics may take a while.