Fig. 15
Download original image
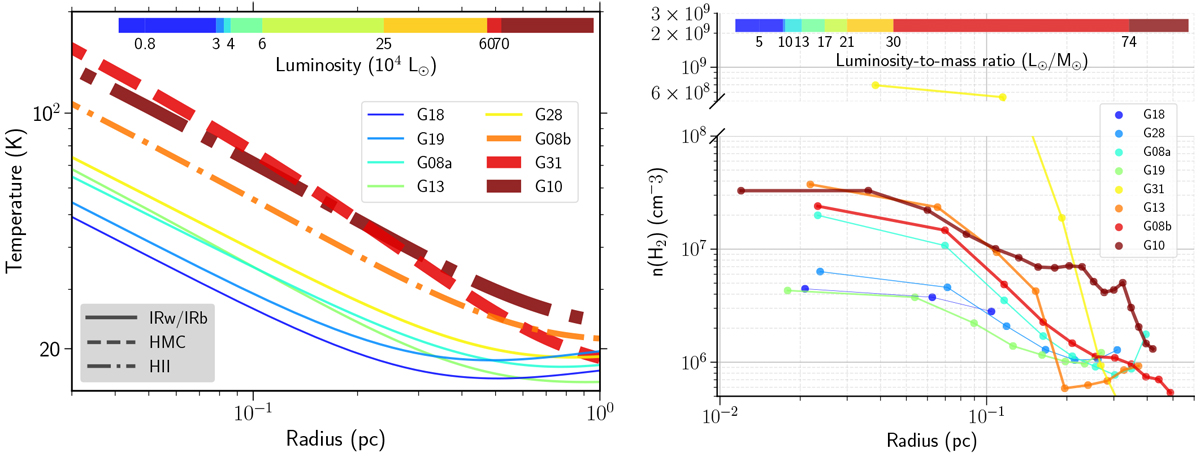
Radial temperature and density profiles of target clumps. Left panel: radial temperature profiles T(r) for all the target sources (Eq. (3), refined T(r) is used for the relevant source). The thickness of the lines increases with increasing luminosity. Right panel: radial (projected radial averaged) density profile of the dense gas (ρdense) of all the target sources, from n(H2) maps derived by RADEX modeling of CH3OH lines. The range of the y-axis is trimmed to increase contrast. For both panels the luminosity and clump mass are calculated from RADMC-3D best-fit model (Table 6), which takes into account all the gas components present in the clumps.
Current usage metrics show cumulative count of Article Views (full-text article views including HTML views, PDF and ePub downloads, according to the available data) and Abstracts Views on Vision4Press platform.
Data correspond to usage on the plateform after 2015. The current usage metrics is available 48-96 hours after online publication and is updated daily on week days.
Initial download of the metrics may take a while.