Fig. 13
Download original image
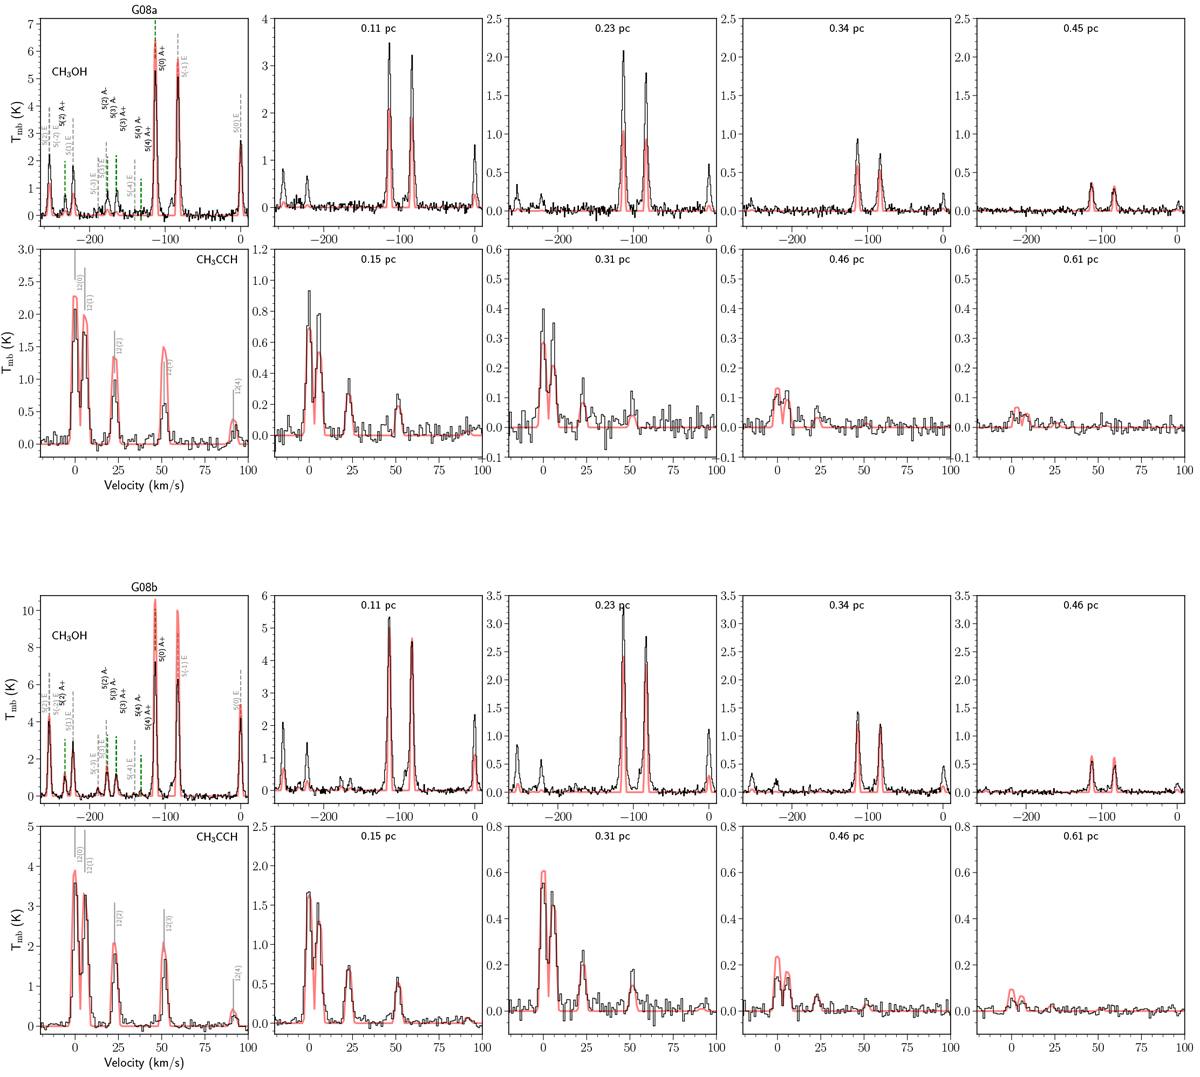
LIME modeling result (best-fit parameters listed in Table 7, Col. A) based on best-fit density model from RADMC-3D continuum modeling. From left to right: Annular beam-averaged spectra from the continuum center to the outer envelope. Considering the typical beam FWHM of our observations: the distance from the center of each annular region to the center of the source is indicated at the top of each spectra. The line components of A- and E-type CH3OH are indicated with short-dashed vertical lines in green and gray, respectively.
Current usage metrics show cumulative count of Article Views (full-text article views including HTML views, PDF and ePub downloads, according to the available data) and Abstracts Views on Vision4Press platform.
Data correspond to usage on the plateform after 2015. The current usage metrics is available 48-96 hours after online publication and is updated daily on week days.
Initial download of the metrics may take a while.