Fig. 11
Download original image
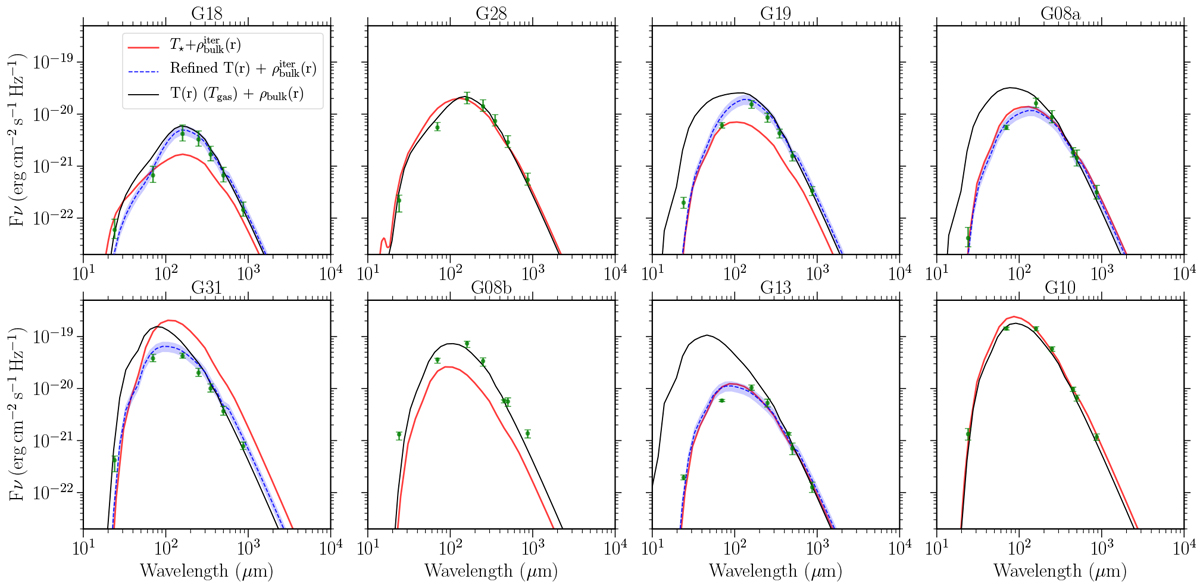
Comparison of SEDs of the best-fit RADMC-3D models with measured multi-wavelength fluxes (green dots with error bars indicating 0.8 and 1.2 times the flux level) for each source. The black line indicates the SED generated from assumed T(r) and the corresponding best density profile fits. The blue dashed line indicates the SED generated from refined T(r) and the re-iterated best density profile fits. The blue shaded regions indicate a 20% difference around the blue dashed SED profile. The red line shows the SED generated by self-consistently calculating the dust temperature adopting a central heating ZAMS star plus the re-iterated best density profile (for more details, see Appendix E).
Current usage metrics show cumulative count of Article Views (full-text article views including HTML views, PDF and ePub downloads, according to the available data) and Abstracts Views on Vision4Press platform.
Data correspond to usage on the plateform after 2015. The current usage metrics is available 48-96 hours after online publication and is updated daily on week days.
Initial download of the metrics may take a while.