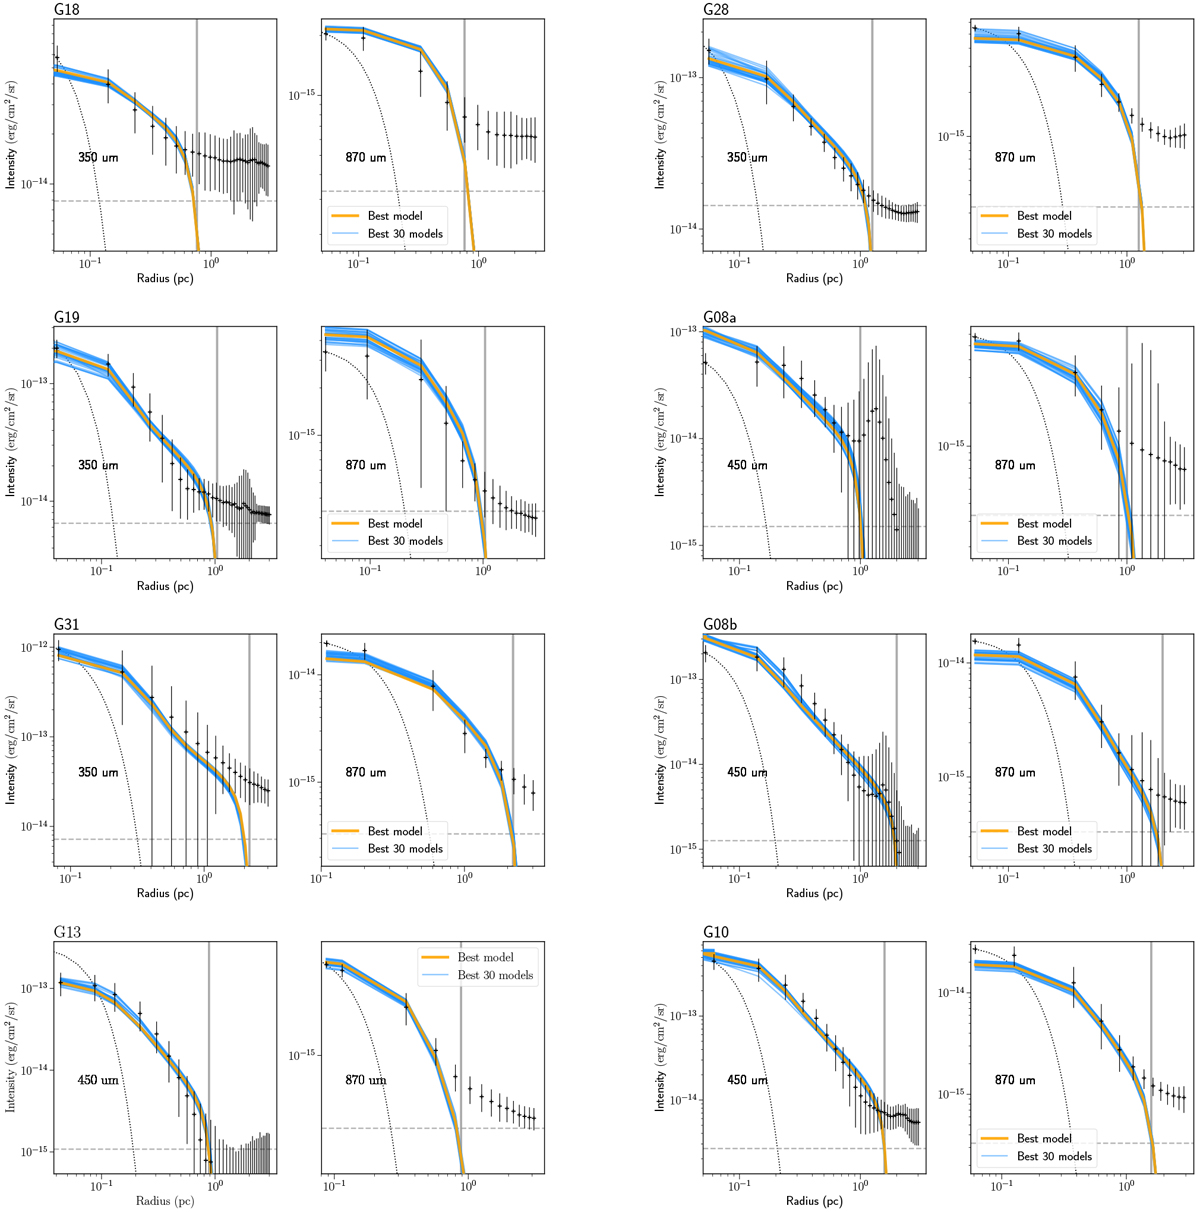
Fig. 10
Download original image
Radial intensity profile comparisons between observations and best-fit RADMC-3D models. Gray horizontal dashed lines indicate the noise level (3σ). Gray vertical lines indicate the clump radius used in the modeling. The dotted line indicates beam shape in each plot. For source G18, G19, G08a, G13, and G31, the model fit after re-adjusting T(r) is shown. The gray vertical line indicates the clump radius Rclump.
Current usage metrics show cumulative count of Article Views (full-text article views including HTML views, PDF and ePub downloads, according to the available data) and Abstracts Views on Vision4Press platform.
Data correspond to usage on the plateform after 2015. The current usage metrics is available 48-96 hours after online publication and is updated daily on week days.
Initial download of the metrics may take a while.