Fig. 2
Download original image
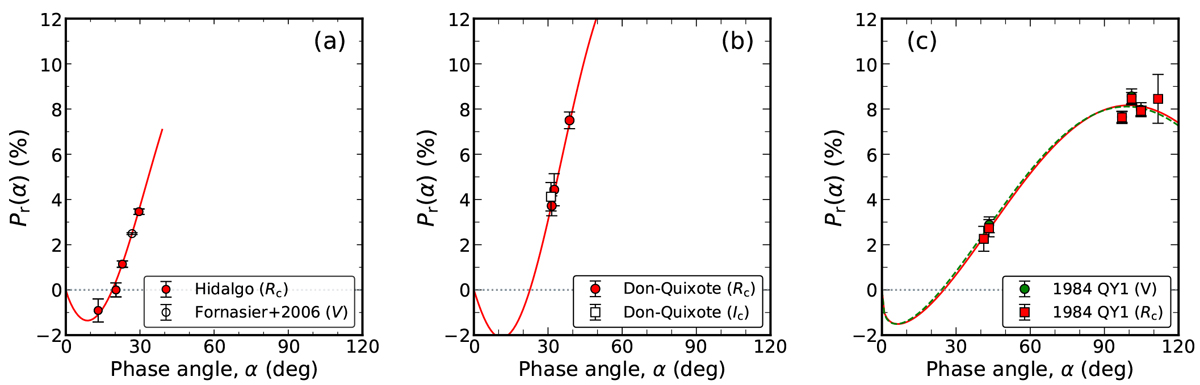
Phase angle dependence of nightly averaged Pr for three ACOs: (a) Hidalgo, (b) Don Quixote, and (c) QY1. Polarization phase curves using the median of the Monte Carlo samples are shown as the red solid line for RC band and the green dashed line for V band by using Eq. (6). For Hidalgo we plot the V -band data (open circle) from Fornasier et al. (2006).
Current usage metrics show cumulative count of Article Views (full-text article views including HTML views, PDF and ePub downloads, according to the available data) and Abstracts Views on Vision4Press platform.
Data correspond to usage on the plateform after 2015. The current usage metrics is available 48-96 hours after online publication and is updated daily on week days.
Initial download of the metrics may take a while.