Fig. 7
Download original image
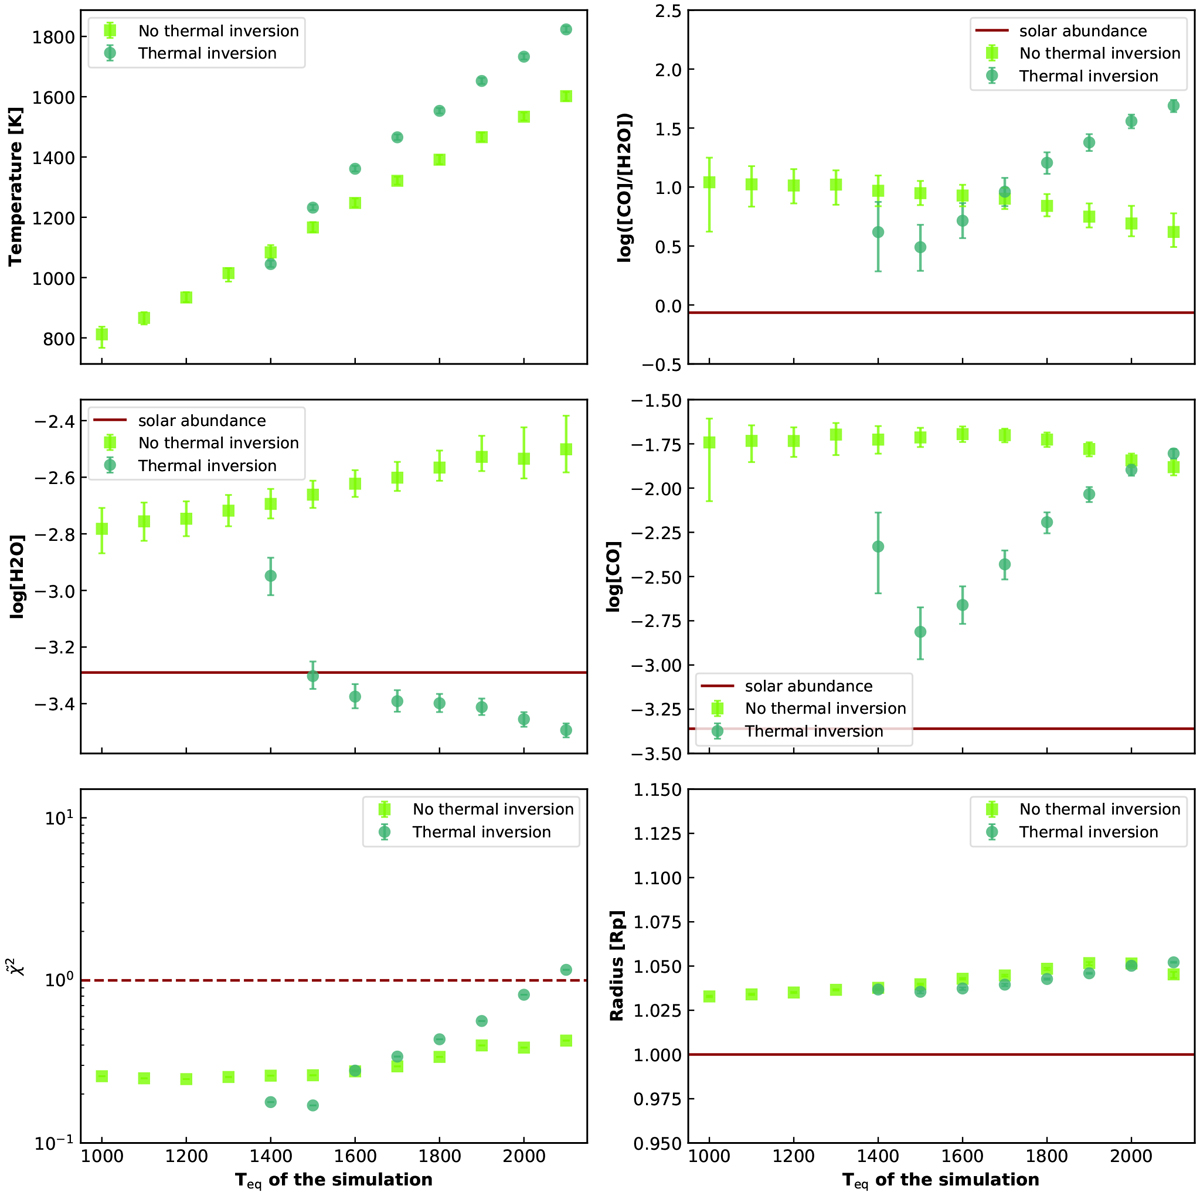
Retrieval results with TauREx assuming an isothermal profile. Cases with and without thermal inversion in the input atmosphere are shown in light and dark green, respectively. We plot the temperature (top left), [CO ]∕[H2O] (top right), the CO (middle right) and the H2O (middle left)abundances, the planetary radius (bottom right) within 1σ
error, and ![]() (bottom left). These results have been obtained with nonrandomized spectra but
(bottom left). These results have been obtained with nonrandomized spectra but
![]() calculations,and TauREx assumes a 30 ppm 1σ
Gaussian noise on the whole spectral domain. The red line represents the input value in the GCM simulations, and the dashed red line shows where
calculations,and TauREx assumes a 30 ppm 1σ
Gaussian noise on the whole spectral domain. The red line represents the input value in the GCM simulations, and the dashed red line shows where
![]() .
.
Current usage metrics show cumulative count of Article Views (full-text article views including HTML views, PDF and ePub downloads, according to the available data) and Abstracts Views on Vision4Press platform.
Data correspond to usage on the plateform after 2015. The current usage metrics is available 48-96 hours after online publication and is updated daily on week days.
Initial download of the metrics may take a while.